Transform Message Component
The Transform Message component enables you to perform transformations over the input data it receives. You can explicitly write out a transformation in DataWeave language, or you can use the UI to build it through dragging and dropping elements.
You can work with two representations of the same transformation, and any changes done to one are matched in real time by the other.
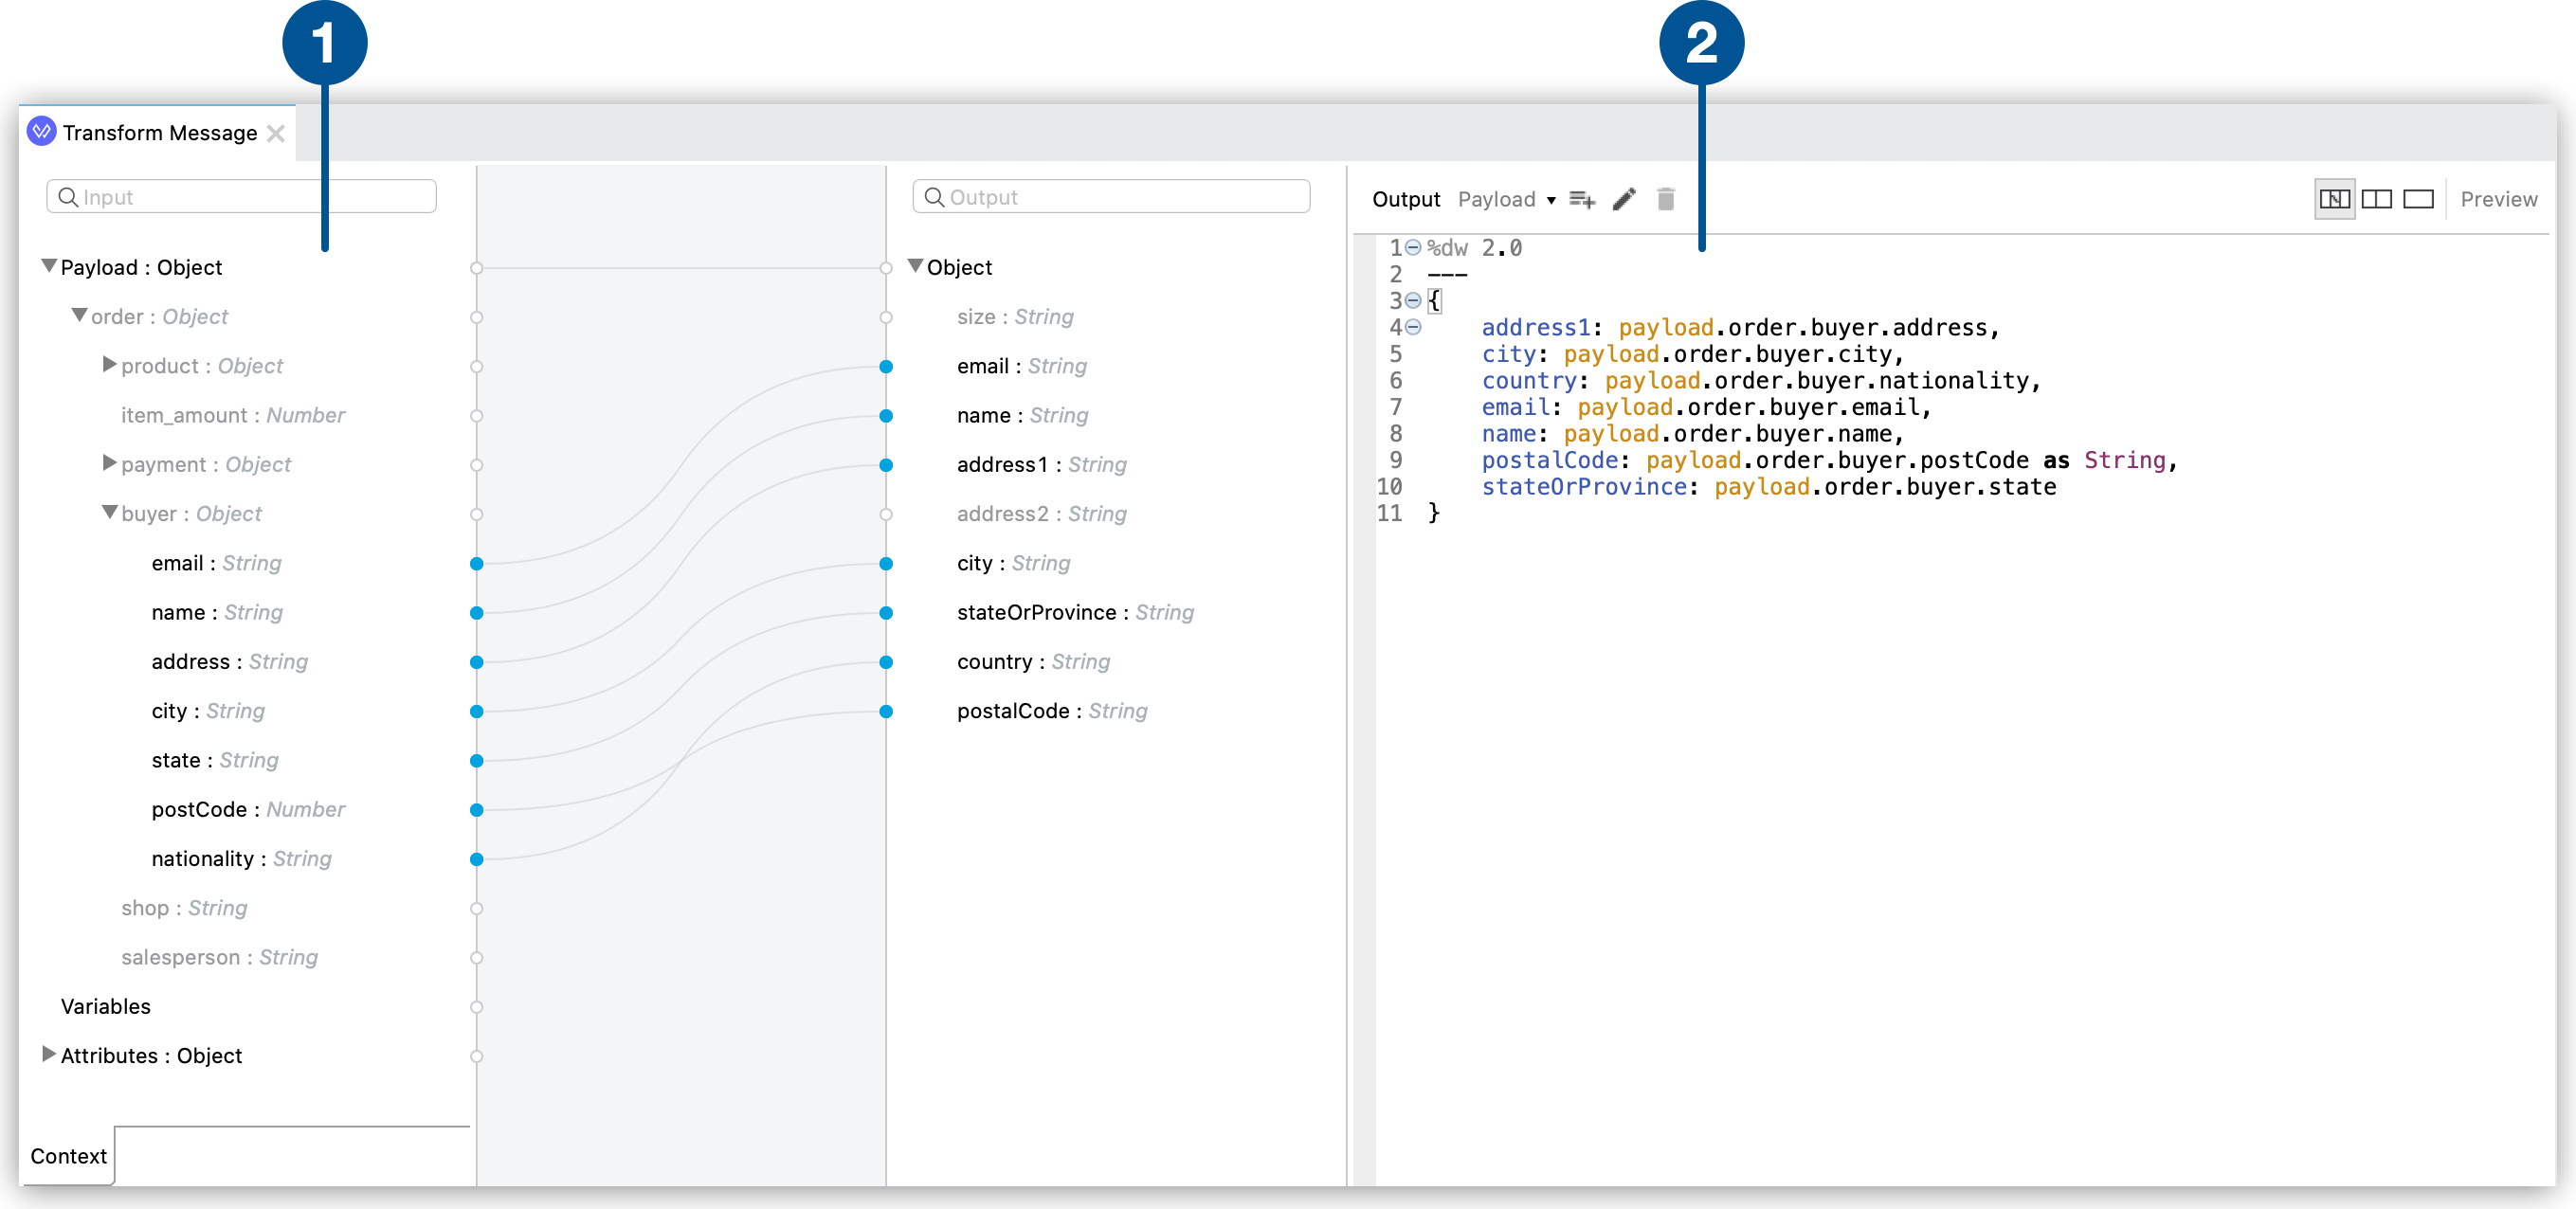
| 1 | Graphical View. Two tree views show the expected metadata structures of the input and output, mappings between these are represented through lines. These can be created through drag and drop. |
| 2 | Source Code View. DataWeave code expresses the transformation in full depth, including functions that aggregate, normalize, group, join, partition, pivot and filter data. |
The Transform Message component leverages metadata from connectors, schemas and sample data. It offers you a preview of your output that is built on sample data and is updated in real time as you make changes to your transformation.
The Transform Message component has three different editor modes:
-
Show Graphics mode.
The Graphical view displays both input and output data structures and a graphical representation of the mappings in your transformation. This mode also displays the Source Code view.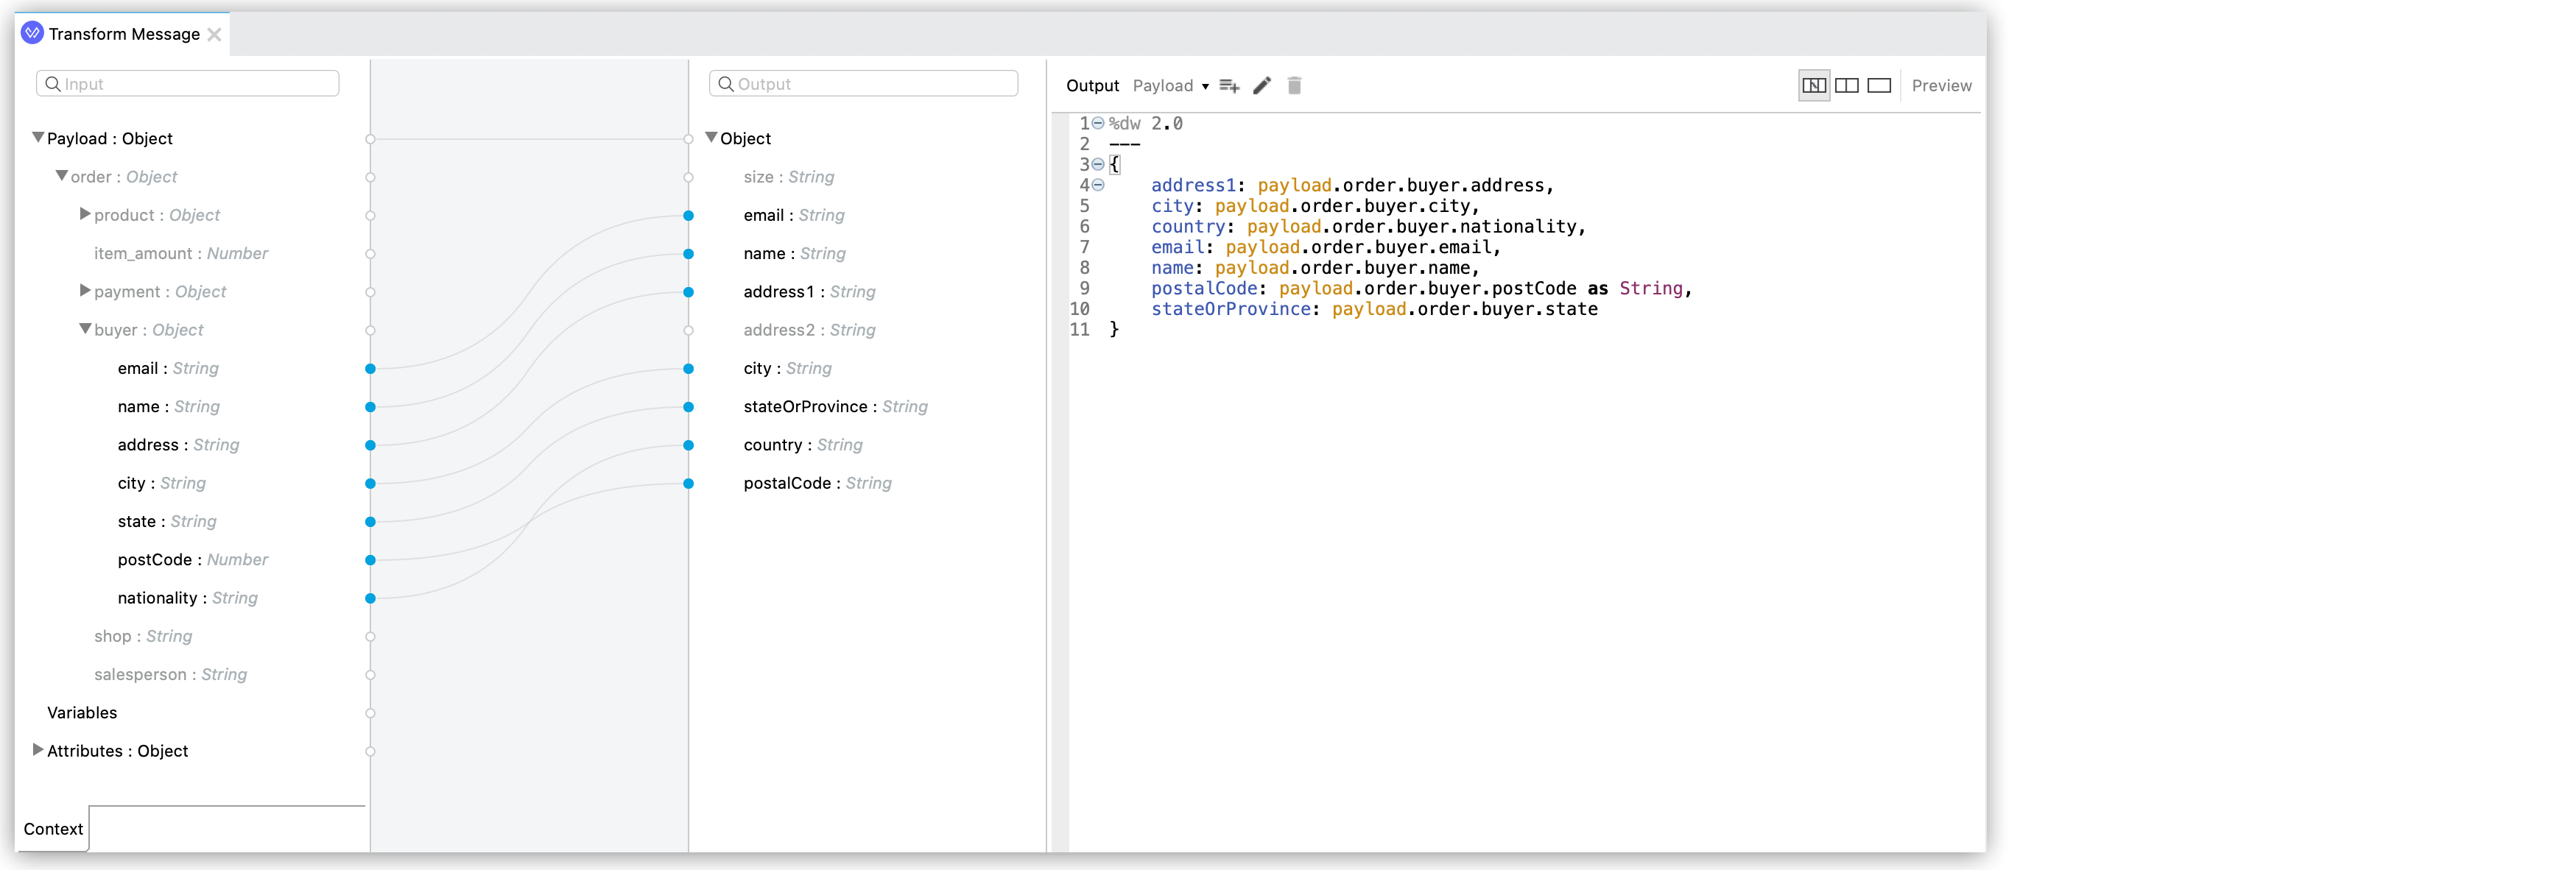
-
Show Source With Trees mode.
The Graphical view displays both input and output data structures without the graphical representation of the mappings. This mode also displays the Source Code view.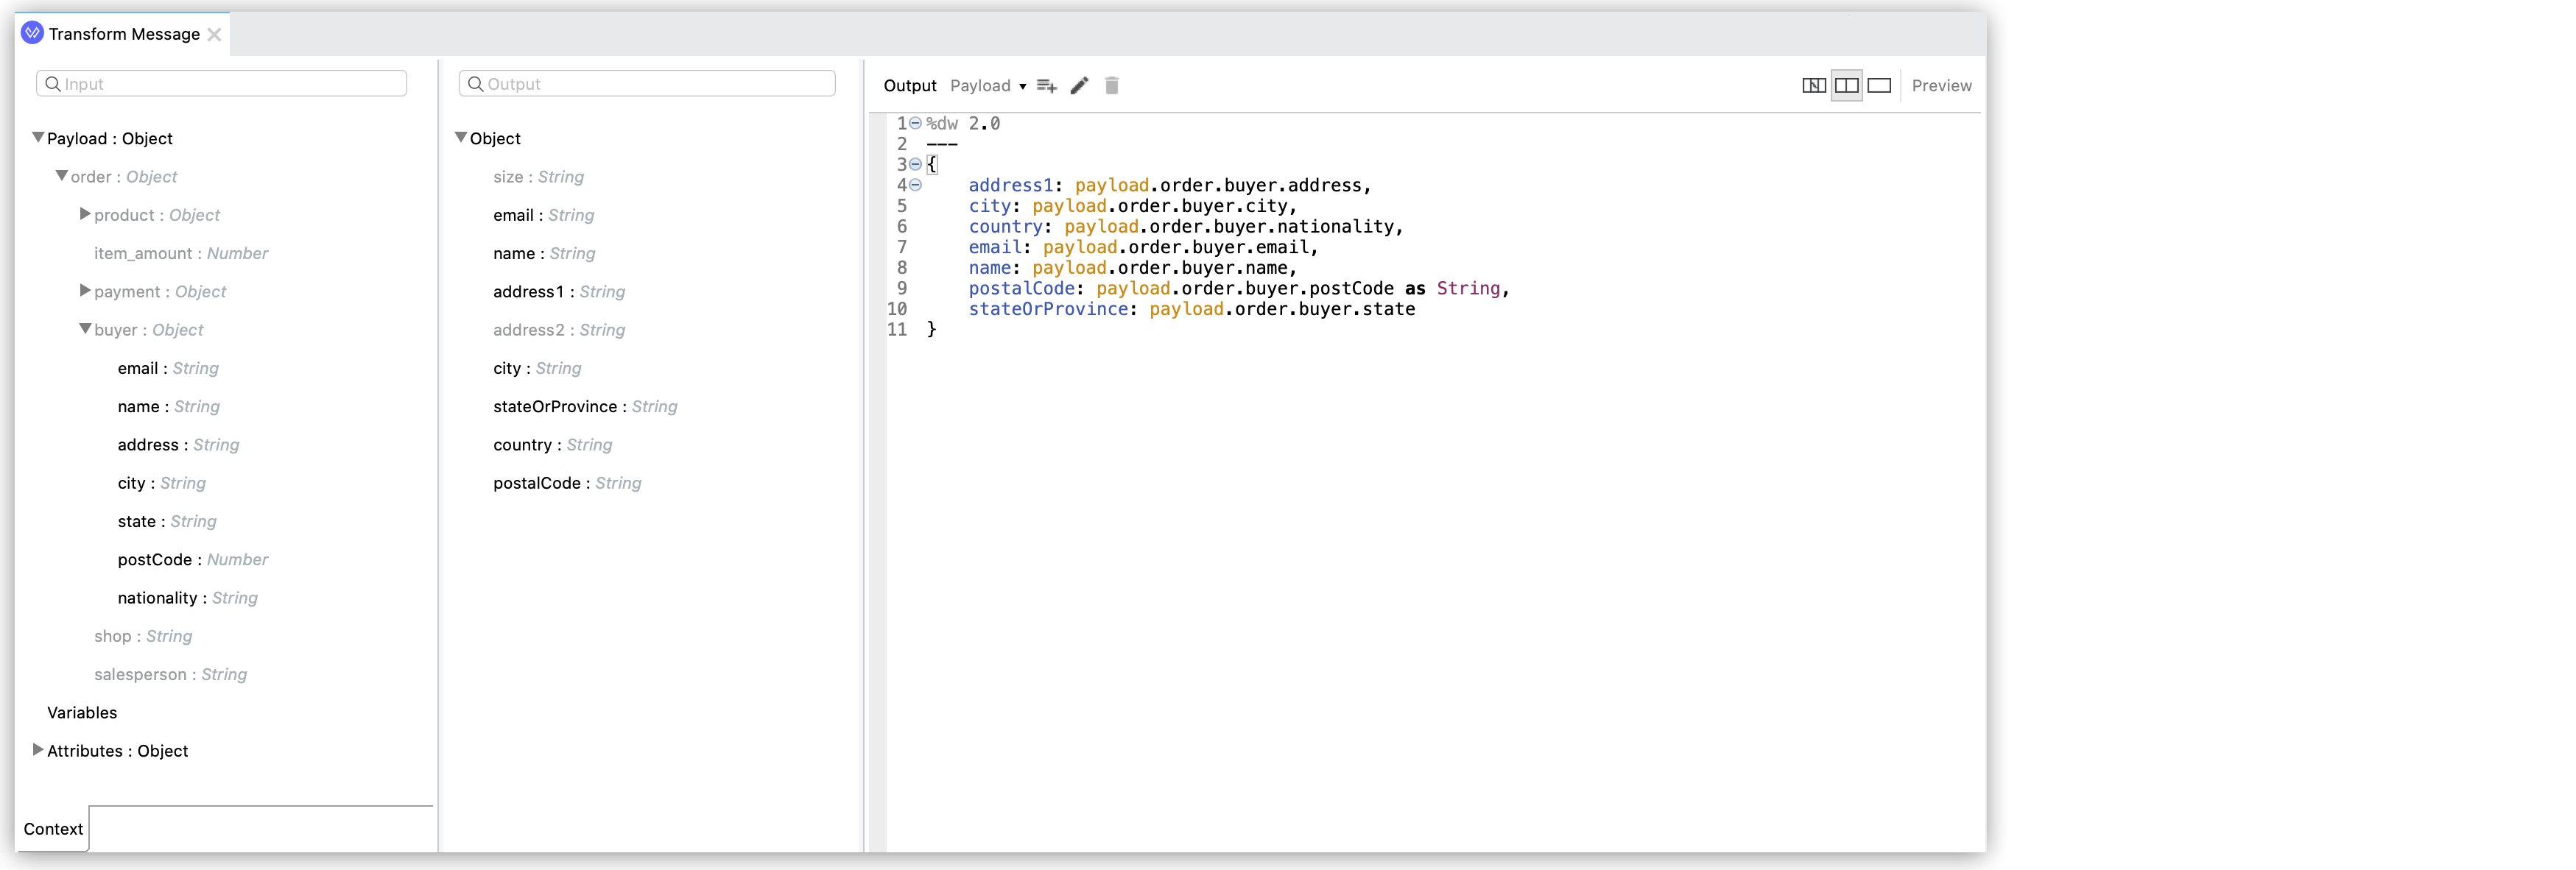
-
Source Only mode.
The Graphical view shows only the input data structure along with the Source Code view.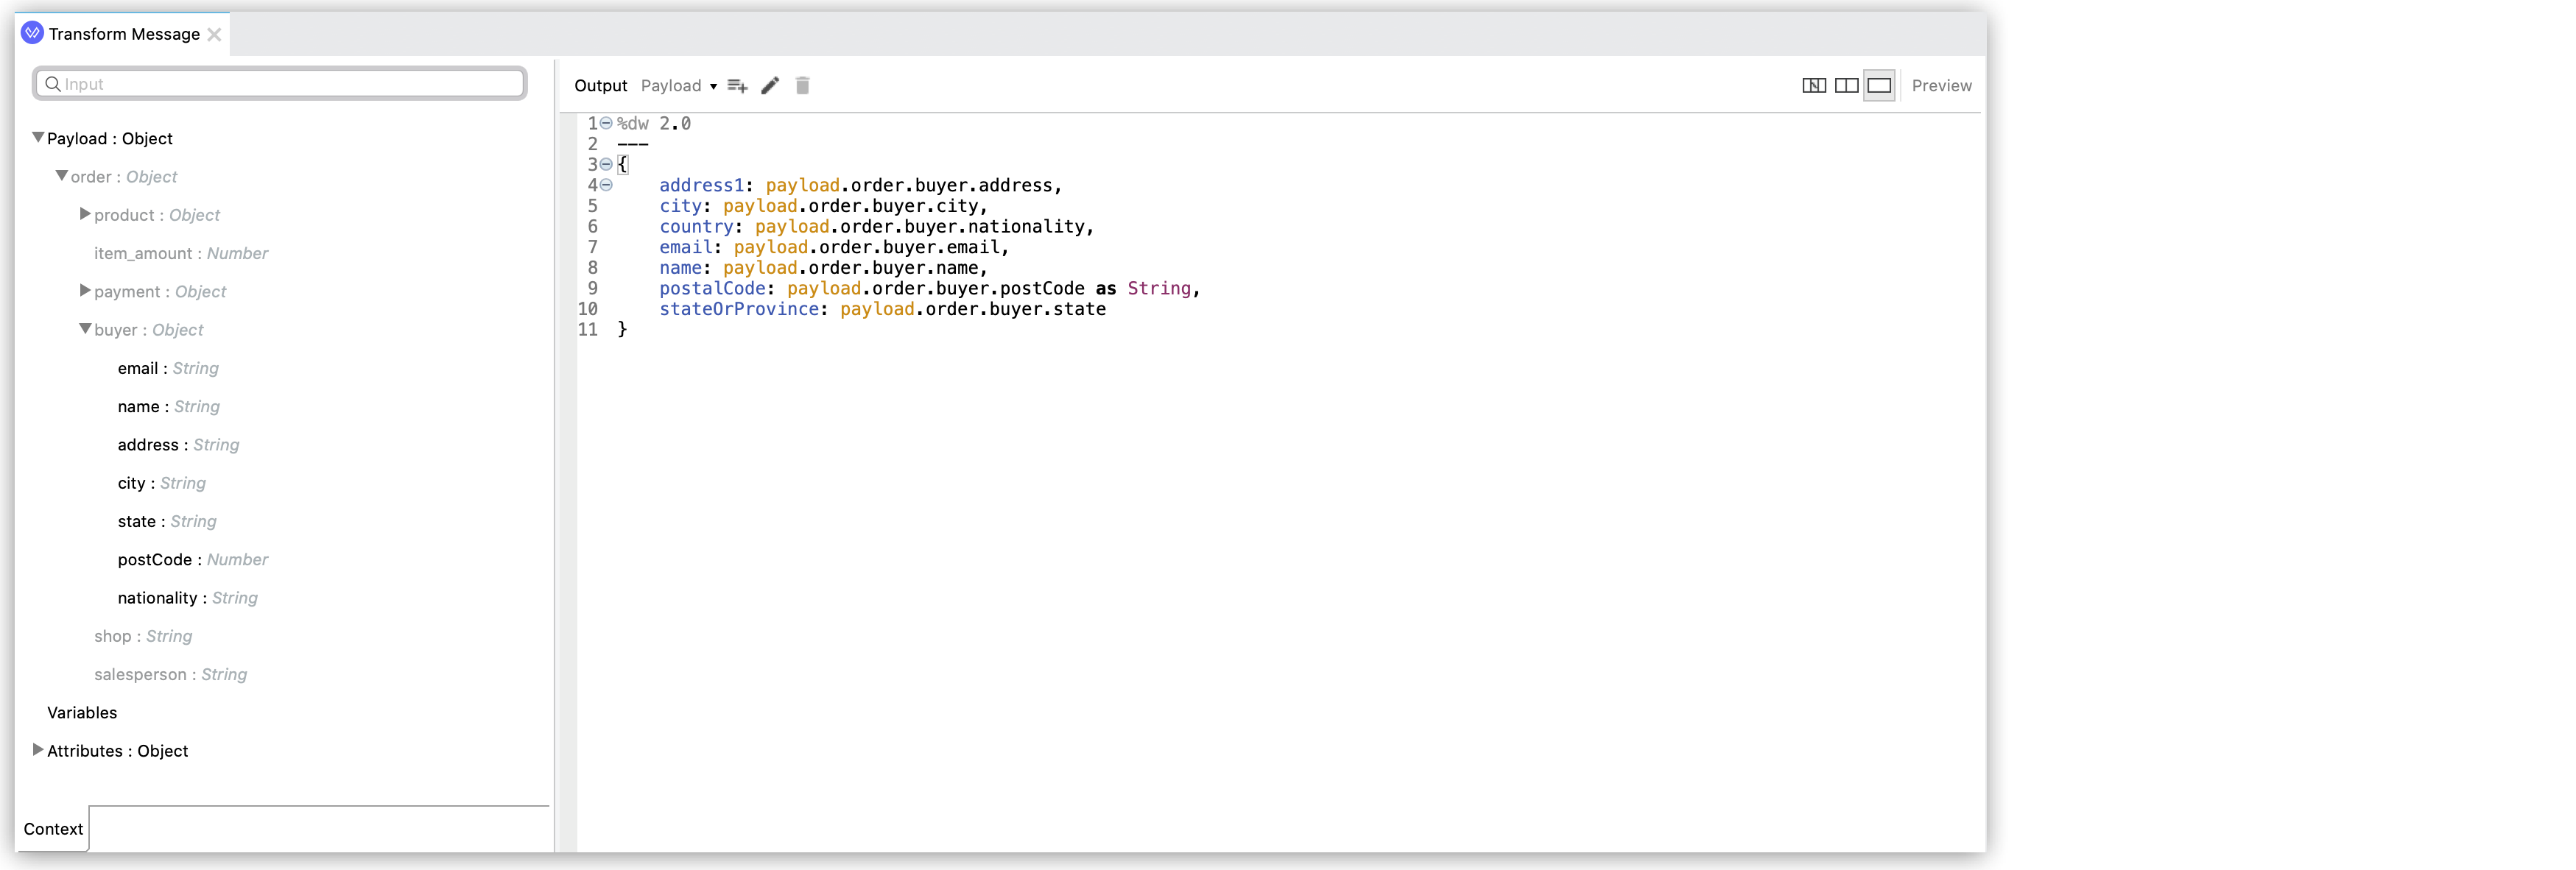
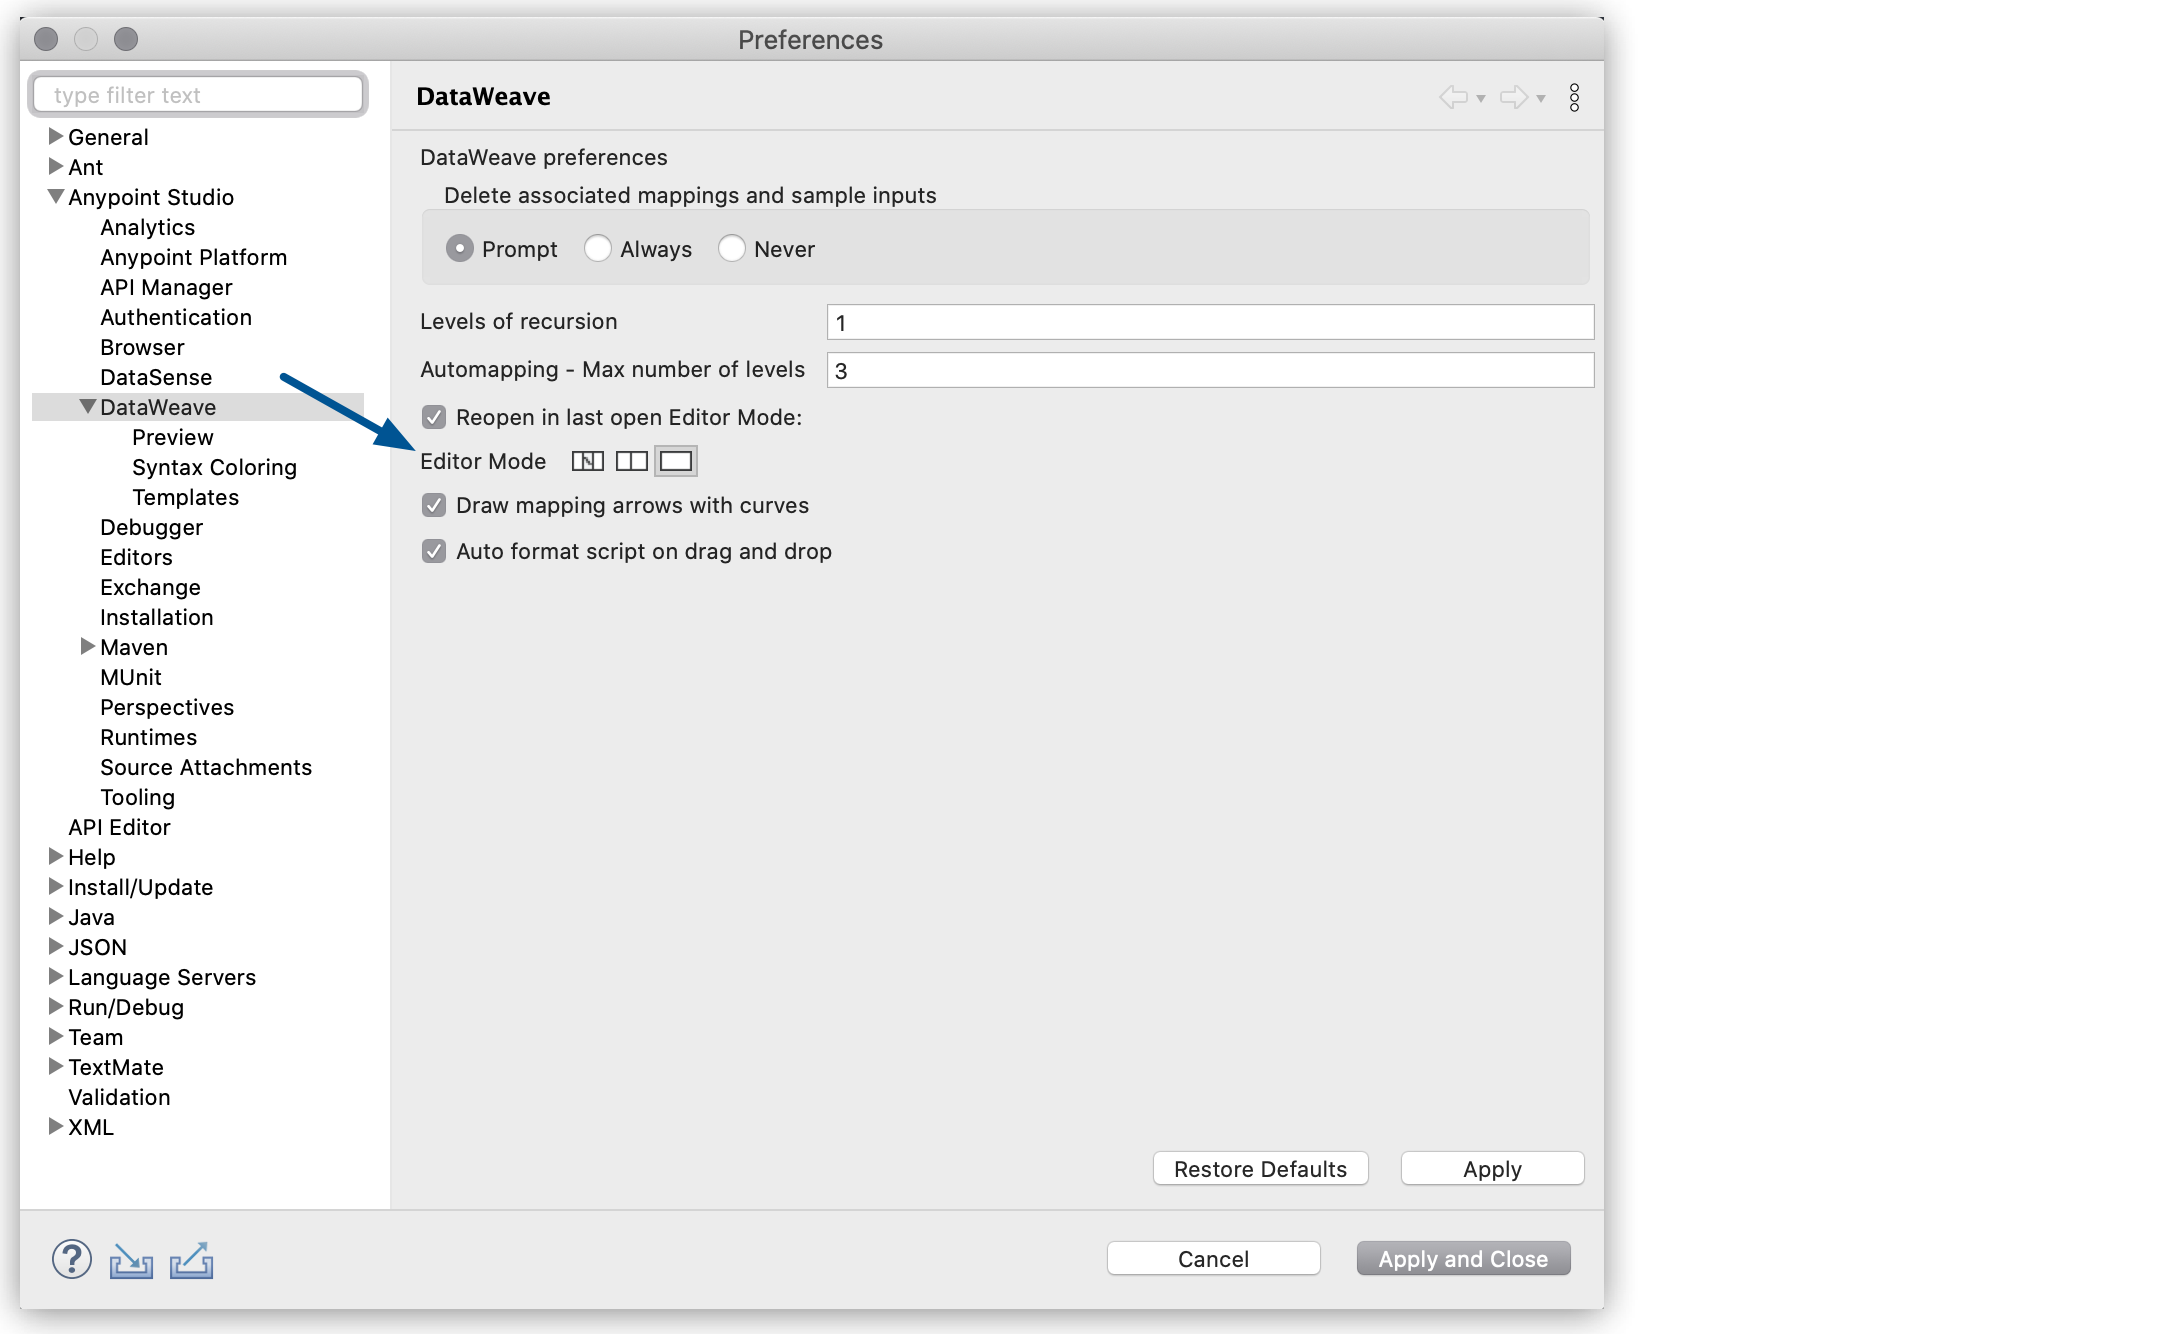
You can define your default editor mode in the DataWeave preferences:
-
Navigate to Anypoint Studio > Preferences.
-
Under Anypoint Studio > DataWeave, select the default editor mode
To improve your experience with the Transform Message component and properly manage your flow’s metadata, consider the following tips:
-
Before creating your mapping, configure everything else on the flow. You can use Datasense to improve to expose your transformation’s input and output metadata. See the DataSense article for more information.
-
To filter what you see from the input or output structures, click the magnifying glass icon
 at the top of either section and then start typing the name of a field.
 -
Select an element in the output pane to have its corresponding line in the DataWeave code highlighted.
-
If an input field is mapped to two or more output fields, you can right-click it and then select which of the multiple outputs you want to highlight in the DataWeave code.