Asset Usage and Engagement Metrics Dashboard
Exchange administrators can use the dashboard to view usage and engagement metrics for API specification fragments and REST APIs. The dashboard provides a holistic view of asset usage and consumption within the organization. The usage metrics measure how many times an asset is downloaded from Exchange, imported from API Designer and Anypoint Studio, and the number of dependents and contracts. The asset engagement score is a composite metric that administrators and asset owners can use to measure the usage of the assets in Exchange. The results of this engagement are the different consumption actions that end-users make across different points of need within Exchange. The engagement score reflects the usage of the asset in the context of the usage of API specification fragments and REST APIs in the customer’s root organization and business groups.
The dashboard displays the metrics for the top 50 assets, ranked by the most consumption events, for a period of the last 7 days, 30 days, or 90 days. You can filter the top assets by API specification fragments and REST API types and by one or more organizations. The metric data can be exported into a CSV file.
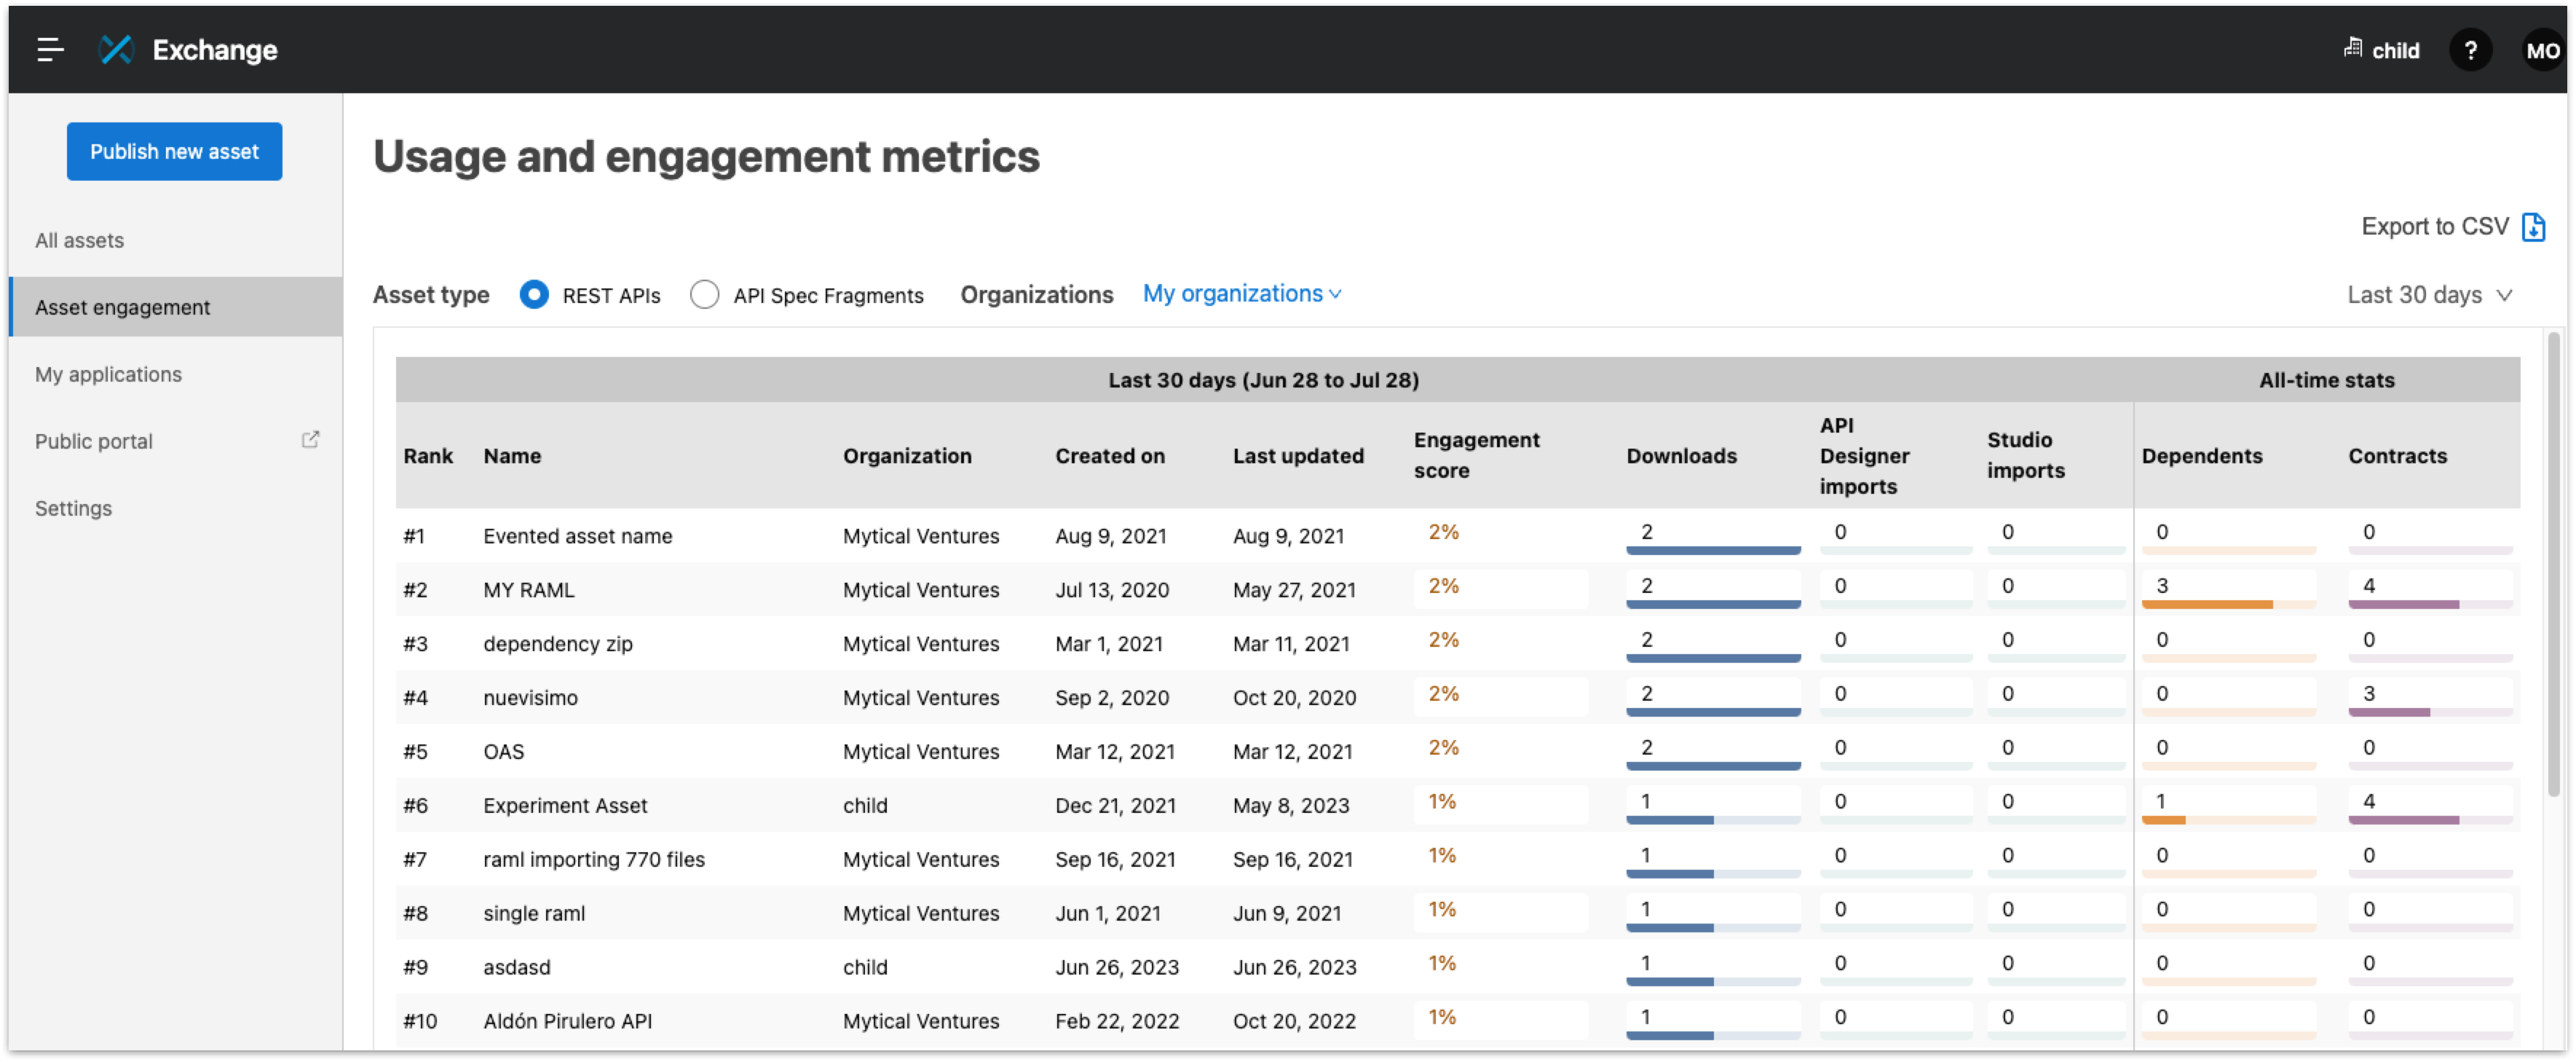
The following graphic shows the Usage and engagement metrics dashboard:
The following data is collected and analyzed:
-
Rank
Assets ranked by the highest number of consumption events for RAML fragments and REST APIs.
-
Name
The name of the asset.
-
Organization
The name of the business organization that the asset belongs to.
-
Created on
The date that the asset was created.
-
Last updated
The date that the asset was last updated.
-
Engagement score
The engagement score reflects the usage of the asset in the context of usage of API specification fragments and REST APIs in the customer’s root organization and business groups.
-
Downloads
The number of times the asset was downloaded. You can sort by ascending or descending order.
-
Imports from API Designer
The number of times the asset was imported from API Designer. You can sort by ascending or descending order.
-
Imports from Studio
The number of times the asset was imported in to Studio.
-
All-time Stats
-
Dependents
The number of dependent assets from the time the version was created.
-
Contracts
The number of approved contracts from the time the version was created.
-
View Asset Usage and Engagement Metrics
Use the dashboard to view metrics for your assets and the filter options from the dashboard to refine API specification fragments or REST API assets. You can select date ranges and filter by asset type and organization.
-
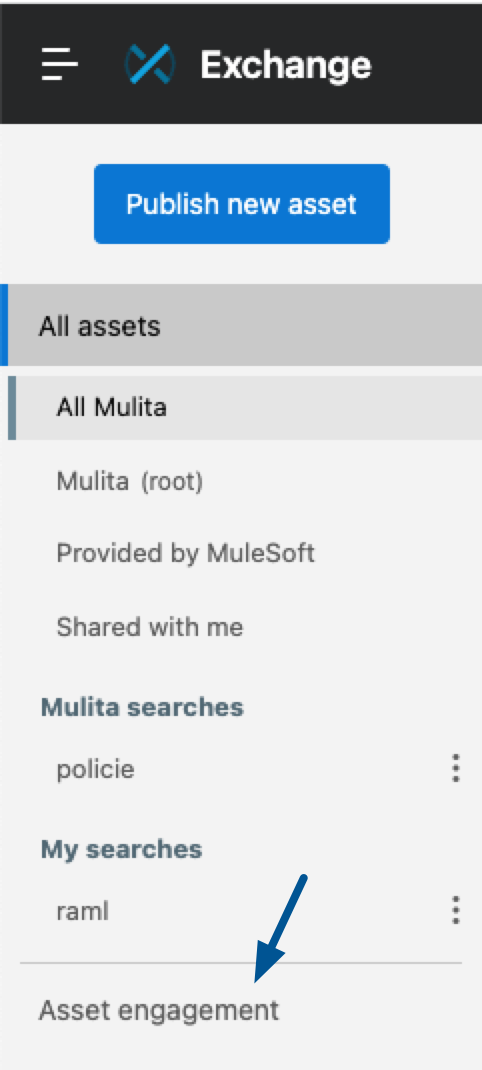
In the navigation bar in Exchange, click Asset engagement.
-
Select a date range from 7 days, 30 days, or 90 days.
The default date range is the last 7 days.
-
If you want to filter by asset type, select an option from Asset type.
-
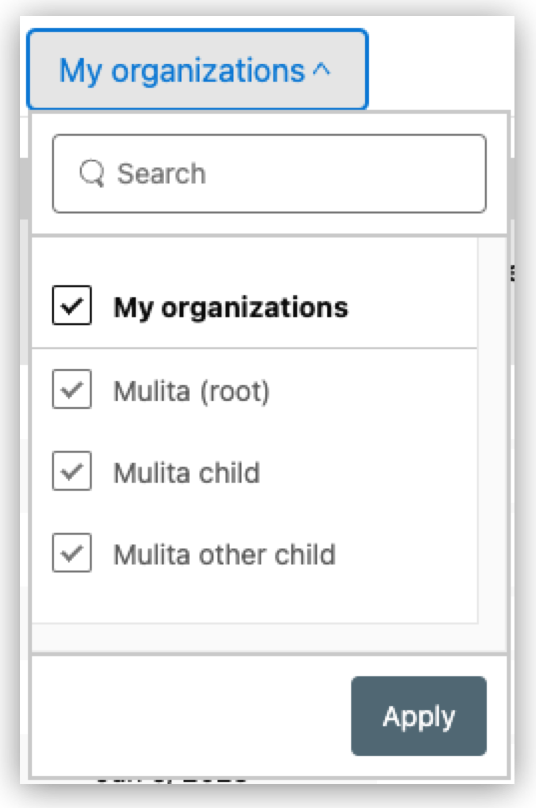
If you want to filter by an organization, click My Organizations.
-
Enter the name of an organization in the Search box to search for an organization.
-
Select one or more organizations and click Apply to filter assets by organization.
-
If you want to view metrics for a specific asset in the list of the dashboard, click the link next to the asset name.
The asset details page displays the usage and engagement metric information for the asset.
-
If you want to view the dependents of an asset, click the Dependents row, which contains one or more dependents.
The dialog displays the list of the version’s dependents for that asset.
-
If you want to export the usage data, click Export to CSV.