Monitoring Dashboards for Mule Apps Deployed to Hybrid Standalone
Monitor your Mule applications deployed to hybrid standalone instances through comprehensive performance dashboards that provide real-time visibility into application health, business metrics, and integration performance across your distributed runtime environment.
Overview
Runtime Manager provides comprehensive application monitoring dashboards for your Mule applications deployed to hybrid standalone environments, so you can:
-
Monitor real-time application performance metrics and transaction flow
-
Analyze business transaction patterns and message processing rates
-
Track application-specific KPIs and custom business metrics
-
Identify performance bottlenecks and integration failures
-
Monitor resource consumption and optimize application efficiency
-
Correlate application performance with business outcomes
|
To view application dashboards, you must have the Runtime Manager Read Applications permission for the target applications. Anypoint Platform Private Cloud Edition doesn’t support the Anypoint Monitoring dashboard feature. |
Runtime Manager provides comprehensive application monitoring through multiple dashboard interfaces designed for different use cases and deployment scenarios.
Application Monitoring Dashboards
Monitor your Mule applications through specialized dashboards that provide insights into integration performance, business transactions, and operational health.
Overview
Application monitoring dashboards help you understand critical aspects of your integration performance:
-
Performance Analysis: When did usage peaks occur and how did they impact system performance?
-
Response Time Correlation: What effect do traffic spikes have on application response times?
-
Resource Utilization: How effectively are your applications using available processing resources?
-
Error Analysis: What impact do high traffic volumes have on message failure rates?
-
Multi-Application Impact: How do resource-intensive applications affect the performance of other applications on shared infrastructure?
Dashboard Types
Runtime Manager provides two application dashboard interfaces optimized for different monitoring needs:
-
Built-in Anypoint Monitoring Dashboard
Advanced metrics and comprehensive monitoring capabilities -
Classic Application Monitoring Dashboard
Essential metrics for basic application monitoring
The dashboard interface displayed depends on your application’s version, deployment target, and monitoring configuration.
CPU and memory information isn’t immediately available in dashboards after an application restarts. To retain historical statistics, use the dashboardStats API or enable Anypoint Monitoring for persistent data storage.
|
Built-in Anypoint Monitoring Dashboard
The built-in Anypoint Monitoring dashboard provides comprehensive application monitoring with advanced metrics, custom visualizations, and multiple analytical views for in-depth performance analysis
The dashboard is available for applications that meet these criteria: * Deployed to CloudHub, Runtime Fabric, or configured hybrid environments * Running on Mule 4.x or later versions * Anypoint Monitoring enabled and properly configured
For detailed configuration and usage information, refer to Built-in Application Dashboard in the Anypoint Monitoring documentation.
Classic Application Monitoring Dashboard
The classic application monitoring dashboard provides essential application metrics focusing on core integration performance indicators: message processing, resource utilization, and system health.
The dashboard is available for applications in these scenarios: * Deployed to CloudHub and running Mule versions earlier than 3.8.7 * Deployed to hybrid standalone instances with basic monitoring enabled * Applications without Anypoint Monitoring configured * Environments where only essential monitoring is required
| The Mule Messages graph displays comprehensive message processing data for the application during the selected time frame, including successful processing, errors, and throughput patterns. |
Access Application Dashboards
Access application monitoring dashboards directly from Runtime Manager for real-time performance analysis and troubleshooting.
To access application monitoring dashboards:
-
In Runtime Manager, click Applications.
-
Click the name of the application you want to monitor.
The dashboard interface displayed depends on your application’s configuration, deployment target, and monitoring setup.
Dashboard Navigation and Features
Navigate application dashboards effectively using comprehensive time range selection and interactive data exploration features.
Time Range Selection
Monitor application performance across different time periods using the time range selector:
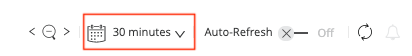
Built-in Anypoint Monitoring Dashboard
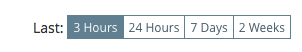
Classic Application Monitoring Dashboard
Data Aggregation by Time Range
Application metrics are aggregated differently based on the selected time range to optimize performance and provide meaningful insights:
| Time Range | Mule Messages | Error Count | Response Time (milliseconds) |
|---|---|---|---|
3 Hours |
Per minute |
Per minute |
Per minute |
24 Hours |
Per 8 minutes |
Per 8 minutes |
Per 8 minutes |
7 Days |
Per hour |
Per hour |
Per hour |
2 Weeks |
Per 2 hours |
Per 2 hours |
Per 2 hours |
Data Visualization Patterns:
-
Multi-Worker Applications
When applications run on multiple workers, each worker appears as a separate curve on graphs, differentiated by color coding. -
Shared Infrastructure
Applications deployed to server groups or clusters display aggregated performance metrics as unified trend lines. -
Performance Correlation
Dashboard data enables correlation between application performance and underlying infrastructure utilization.