Configuring Mule Stacktraces
By default Mule filters out some internal class references from stacktraces to produce a more readable output. This behavior can be controlled one of three ways:
-
Command-line arguments
-
Setting properties in Mule Studio
-
Using JMX
Command-Line Arguments
Two command-line properties let you control this behavior using -M-DpropertyName:
-
mule.stacktrace.full- When present, Mule does not filter stacktraces. Intended for Mule developers only, end users probably never need to enable this. (You can also use the propertymule.verbose.exceptions=true, with the same result.) -
mule.stacktrace.filter- A comma-separated list of packages and/or classes to remove from the stacktraces, which are matched viastring.startsWith().
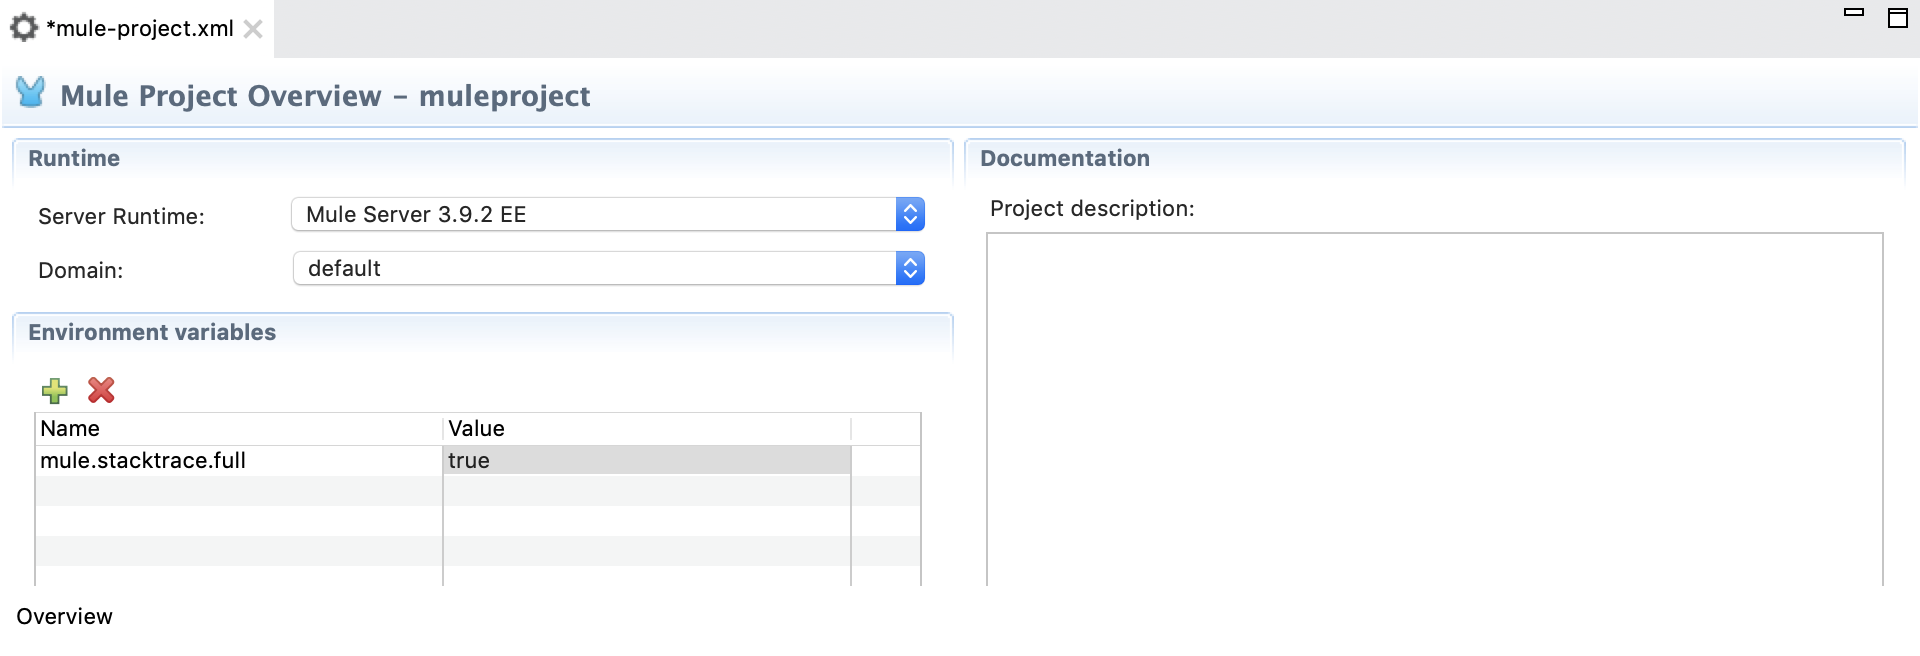
Setting Properties in Anypoint Studio
In Studio, you can set the same properties specified above to instruct Mule to provide either unfiltered stacktraces or to configure a particular filter of packages or classes to remove. To adjust these settings:
-
Under the Package Explorer view open your
mule-project.xmlfile.
-
Define environment variables to specify the behavior you want.
In the example below, the mule.stacktrace.full property is set to true.
Using JMX
The Configuration MBean now exposes two new options:
-
FullStackTrace- Same as above -
StackTraceFilter- Same as above
|
These settings are shared between apps even though each app has its own configuration MBean. That means that modifying it in one app affects others. |
Obtaining the Stacktrace and Thread Dump
Follow these steps to perform an autopsy for Mule in case it stops and you need more information to find the cause.
Obtain the Mule process ID, which we will refer to simply as MULE_PID. To identify the Mule process, use the Unix/Linux ps command, or instead execute the jps command from the terminal. The jps tool ships with the JDK used to run Mule. For example, a line containing "MuleContainerBootstrap" or "ApplicationDeployer" or similar would identify the Mule process.
Getting the Thread Dump
Modern JDKs include the jstack tool, which you can utilize to get the thread dump:
jstack -l MULE_PID > filename.tdump
Getting Heap Dump on Out of Memory Error
Perform this procedure if you want to get a heap dump when the Mule server throws an Out Of Memory error: java.lang.OutOfMemoryError: Java heap space
Procedure
Oracle Java Virtual Machine provides a JVM modifier to gather this information. Note that you must restart the Mule server after applying this change, and reproduce the OOM error one more time.
To apply this modifier to the JVM used by Mule, you can set a parameter in Mule’s /conf/wrapper.conf, which automatically triggers the creation of a heap dump during:
wrapper.java.additional.<n>=-XX:+HeapDumpOnOutOfMemoryError
wrapper.java.additional.<n+1>=-XX:HeapDumpPath=path/to/dumps
-
change <n> to a number that follows the sequence in
wrapper.conf
If no path is defined for a heap dump, the file will be created in the directory where the java process was launched. The heap dump file should then be generated as java_pid<pid>.hprof.<unique number>.