wrapper.java.additional.<n>=-agentpath:<absolute-path-to-the-agent>=delay=10000
Profiling Mule
Profiling Mule can be useful in helping you identify memory leaks in your custom Mule ESB extensions.
To profile a Mule, you need to load a Java Profiler into the Mule instance.
Although there are multiple Java profiler options available, we recommend using YourKit, a commonly used Java profiler for analyzing JVM performance.
There are two main methods to profile a Mule instance:
|
Configuring YourKit from the Mule configuration file requires you to restart your Mule instance. Running the profiler in Attach Mode allows you to profile a running instance without restarting it, however certain restrictions apply. |
If you’re not using YourKit, visit your respective profiler’s documentation to understand how to hook into the Mule-Java process.
Hooking Mule into the YourKit Agent
In order to use your own YourKit profiler, you need to first download the YourKit build to your Mule host, and add the following line to the wrapper.conf file located in the $MULE_HOME/conf path:
This enables the YourKit agent to interact with your Mule instance.
The <absolute-path-to-the-agent> value varies depending on the configuration and OS of your machine. Once you downloaded and expanded YourKit package content, you can usually find the agent inside the /bin/ folder.
| You can download older build versions from the previous Profiler releases page. |
Assuming you downloaded yjp-2013-build-13062 for Linux, for example, the entry to add in wrapper.conf should look like this:
wrapper.java.additional.<n>=-agentpath:/yjp-2013-build-13062/bin/linux-x86-64/libyjpagent.so=delay=10000
The <n> component of the Java Service Wrapper needs to be in sequence with the rest of the wrapper.java.additional components in your wrapper.conf file.
|
By default, YourKit agent scans for an internet facing port. If a specific port is desired, you can set it by adding:
wrapper.java.additional.<n>=-agentpath:<absolute-path-to-the-agent>=delay=10000,port=<port>.
A full list of start up parameters can be found in YourKit startup options.
Restart Mule and set the YourKit profiler UI to connect to the host (with port, if specific port was specified).
Check YourKit documentation for a more detailed explanation on how to properly launch the agent based on your operative system.
Connect the YourKit UI to a Local Mule
-
Launch YourKit on your local machine.
-
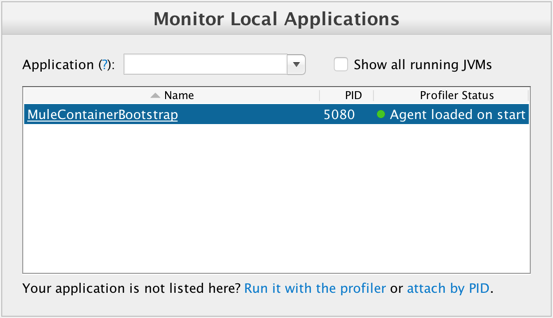
In Monitor Local Applications, double click the
MuleContainerBootstrapprocess
-
YourKit should now be hooked up to your Mule instance.

Connect the YourKit UI to a Remote Mule
-
Launch YourKit on your local machine.
-
In Monitor Remote Applications, click Connect to remote application.

-
Set up your server username and password.
-
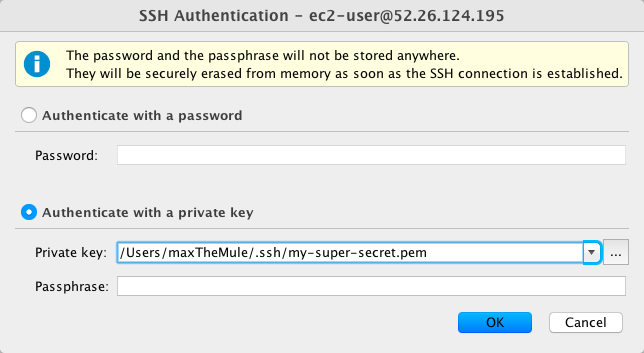
Configure the SSH authentication.

-
Click OK.
-
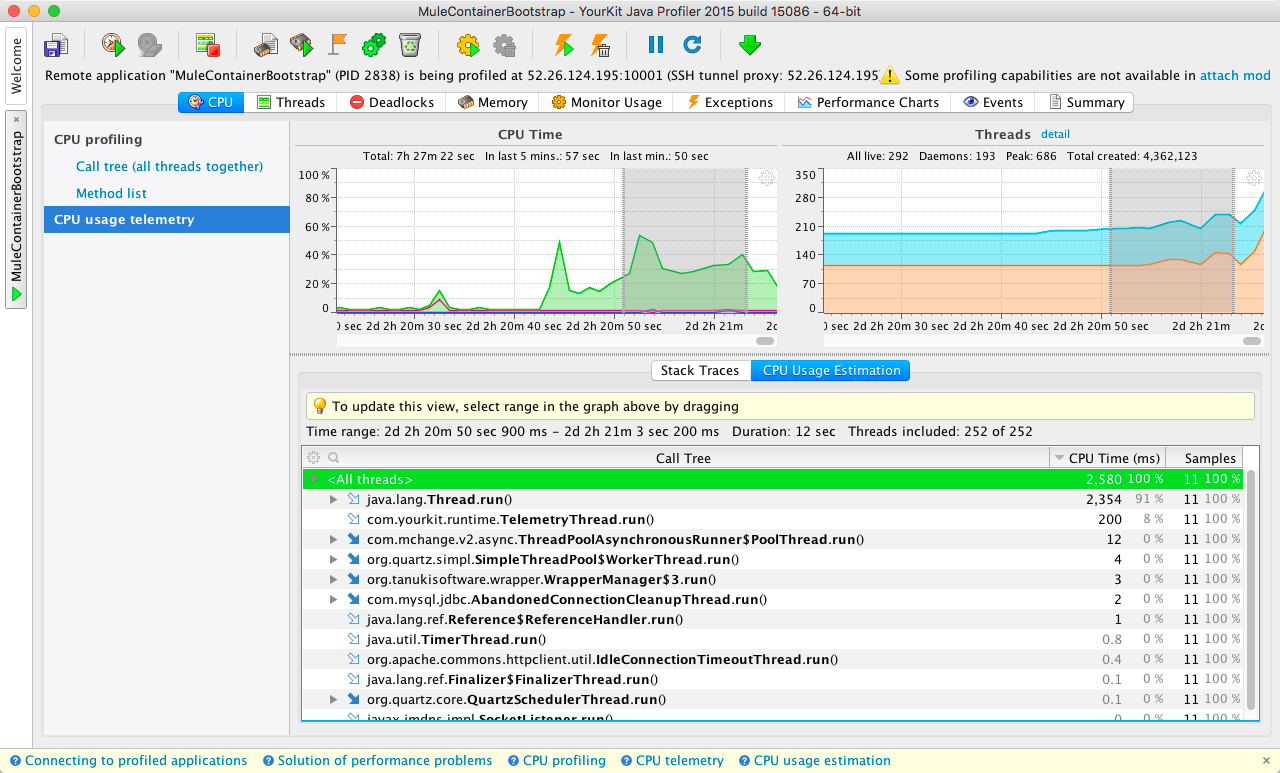
After scanning for available applications, the YourKit should now be hooked up to your Mule instance.

Running the Profiler Agent in Attach Mode
-
Download the profiler to the Mule server.
-
Unpackage the profiler.
-
Determine the PID of Mule by running
jps.jps -
Capture the PID of the
MuleContainerBootstrap.2838 MuleContainerBootstrap 21311 Jps
-
Within the YourKit package, open the
bindirectory.cd yjp-2015-build-15086/bin -
Run
yph.shincluding the-attachflag with the PID ofMuleContainerBootstrap../yph.sh -attach 2838 -
Verify the agent is attached
Attaching to process 2838 using default options
The profiler agent has attached. Waiting while it initializes...
The agent is loaded and is listening on port 10001.
You can connect to it from the profiler UI.
| Steps above can vary in a Windows environment. Check the YourKit documentation if the steps above cannot be translated. |
Enabling the Profiler Agent
The Profiler agent exposes the YourKit Profiler to JMX to provide CPU and memory profiling. You configure the Profiler agent with the <management:yourkit-profiler/> element. For more information, see JMX Management.
Running the Profiler
To run the profiler, you run Mule with the -profile switch plus any extra YourKit startup options with multiple parameters separated by commas, for example, -profile onlylocal,onexit=memory. This integration pack automatically takes care of configuration differences for Java 1.4.x and 5.x/6.x.
For example:
./mule -profile
Embedded Mule
If you are running Mule embedded in a webapp, the Profiler configuration is completely delegated to the owning container. Launch YourKit Profiler, Tools > Integrate with J2EE server and follow the instructions. Typically, a server’s launch script is modified to support profiling, and you then use this modified start script instead of the original.


