
Graphically Construct a Mapping (Anypoint Studio)
Through the graphical UI of the Transform Message component you can do the tasks below. When doing each, the necessary lines are added to the DataWeave code to describe the action.
Map a Field
Drag an element on the input structure over to another on the output structure, this casts a line that joins them.

Map a Structure
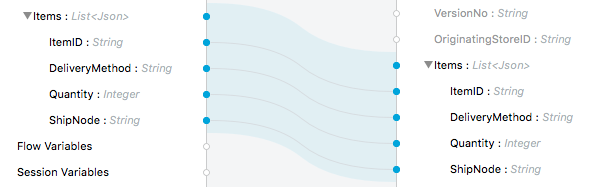
Drag a high-level structure that contains lists of elements or inner fields onto another in the output. This creates a shaded region covering all the mapped structure. Fields that have identical names in these structures are automatically mapped too.
Set a Fixed Value or Function
-
Double click on a field in the output tree. This adds a function icon
 next to it.
 -
A new line is added to the DataWeave code that assigns a default
nullvalue to the field. This line is highlighted. Change its value to anything you want.
You can add:
-
A fixed string value by using " ".
-
A reference to an input field.
-
A DataWeave statement that includes functions.