
Profiling Mule
Profiling Mule runtime engine (Mule) can help you identify memory leaks in your custom Mule extensions.
To profile Mule, you need to load a Java Profiler into the Mule instance.
Although there are multiple Java profiler options available, MuleSoft recommends using YourKit, a commonly used Java profiler for analyzing JVM performance.
If you’re not using YourKit, visit your respective profiler’s documentation to understand how to connect to the Mule-Java process.
There are two methods to profile a Mule instance:
Configure Mule to Point to the YourKit Agent
For this method, you download the YourKit profiler, you configure it in the wrapper.conf file, and then restart your Mule instance. To finalize the process, you connect the YourKit UI to your local or remote Mule instance.
Check the YourKit documentation for a detailed explanation on how to properly launch the agent based on your operating system, and to get a full list of start up parameters.
To use your own YourKit profiler agent, you need to:
-
Download the YourKit build to your Mule instance. You can download older build versions from the previous Profiler download releases page.
-
Expand the YourKit package content and find the agent inside the
/bin/folder. -
Enable the YourKit agent to interact with your Mule instance by adding the following line to the
wrapper.conffile located in the$MULE_HOME/confpath:
wrapper.java.additional.<n>=-agentpath:<absolute-path-to-the-agent>=delay=10000
The values of these fields are as follows:
-
<absolute-path-to-the-agent>value varies depending on the configuration and operating system of your machine. -
<n>this component of the Java Service Wrapper needs to be in sequence with the rest of thewrapper.java.additionalcomponents in yourwrapper.conffile. -
<port>is an optional port specification. By default, YourKit agent scans for an internet facing port.
Assuming you downloaded yjp-2013-build-13062 for Linux, for example, the entry to add in the wrapper.conf should look like this:
wrapper.java.additional.<n>=-agentpath:/yjp-2013-build-13062/bin/linux-x86-64/libyjpagent.so=delay=10000,port=<port>
-
Restart Mule.
-
After Mule restarts, you set the YourKit profiler UI to connect to your local or remote Mule instance.
Connect the YourKit UI to a Local Mule Instance
-
Launch YourKit on your local machine.
-
In Monitor Local Applications, double-click the
MuleContainerBootstrapprocess: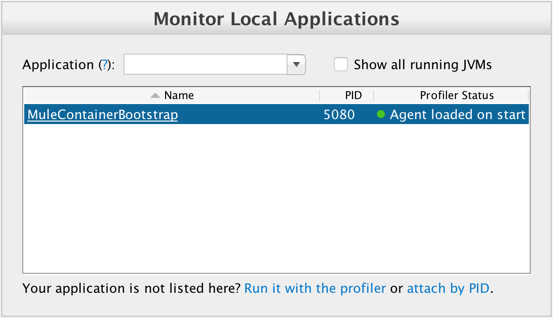
-
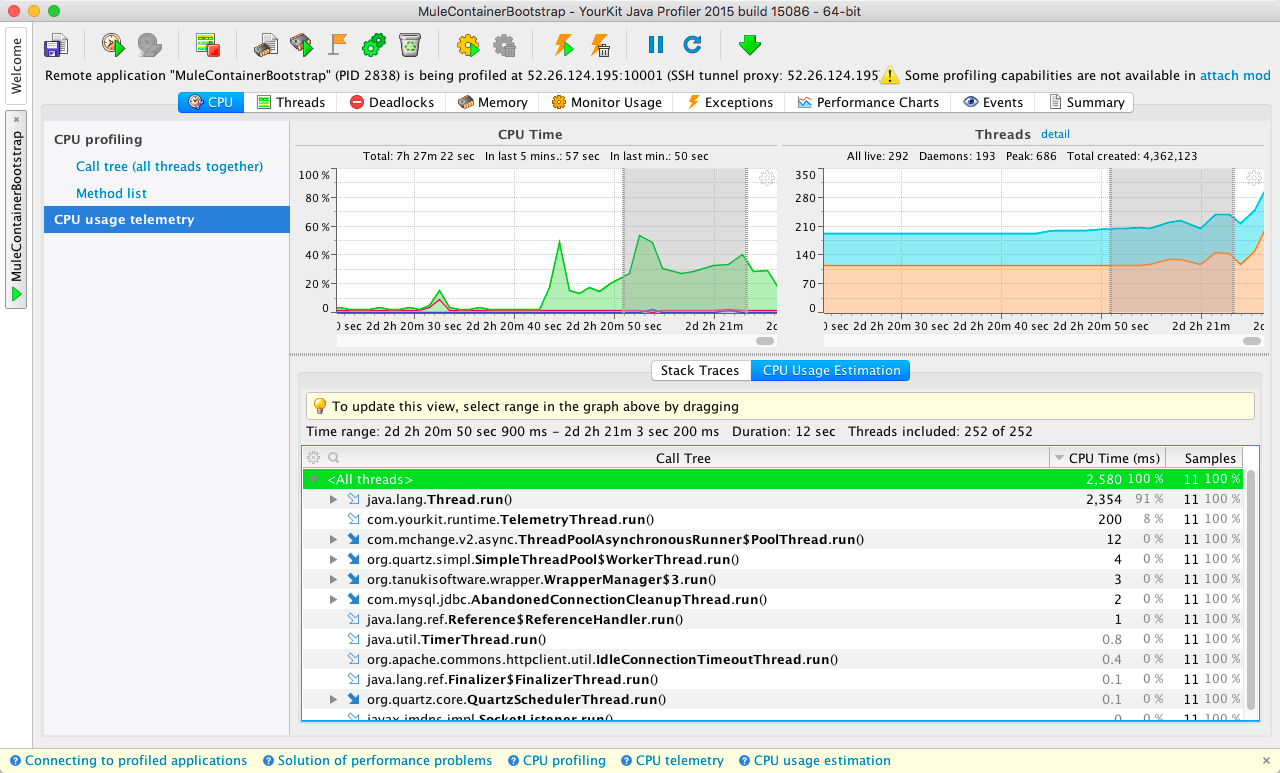
Confirm that YourKit is connected to your Mule instance:
Connect the YourKit UI to a Remote Mule Instance
-
Launch YourKit on your local machine.
-
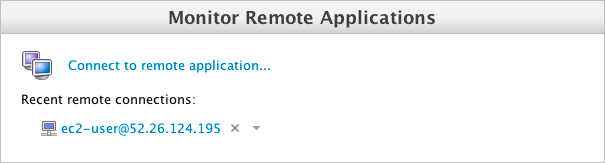
In Monitor Remote Applications, click Connect to remote application.
-
Set up your server username and password.
-
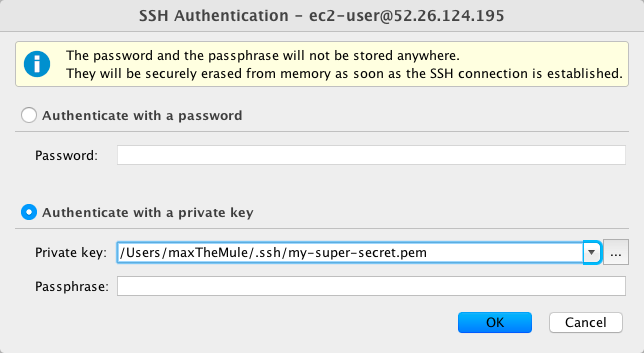
Configure the SSH authentication:
-
Click OK.
-
After scanning for available applications, YourKit should be hooked up to your Mule instance.
Running the Profiler Agent in Attach Mode
For this method, you download the YourKit profiler and configure its agent to run in attach mode. To finalize the process you run the profiler. Running in attach mode enables you to profile a running Mule instance without restarting it.
The steps for this task vary depending on your environment. Refer to YourKit documentation if the examples here are not appropriate.
-
Download the profiler to your Mule instance.
-
Unpackage the profiler.
-
Determine the PID of Mule by running
jps.jps -
Capture the PID of the
MuleContainerBootstrap.2838 MuleContainerBootstrap 21311 Jps
-
Within the YourKit package, open the
bindirectory.cd yjp-2015-build-15086/bin -
Run
yph.sh, including the-attachflag with the PID ofMuleContainerBootstrap:./yph.sh -attach 2838 -
Verify the agent is attached
Attaching to process 2838 using default options
The profiler agent has attached. Waiting while it initializes...
The agent is loaded and is listening on port 10001.
You can connect to it from the profiler UI.