Performance Monitoring
To complement performance testing best practices, monitor the resources consumed by Mule runtime engine (Mule) during the tests. The following information identifies the metrics that are most important to monitor for each main system resource and the tools to use for CloudHub monitoring.
The resource monitoring commands documented here are for a Linux OS with sysstat installed.
CPU Resource
Increased load can exhaust CPU resources. There are several ways to monitor these resources. Two of them are:
-
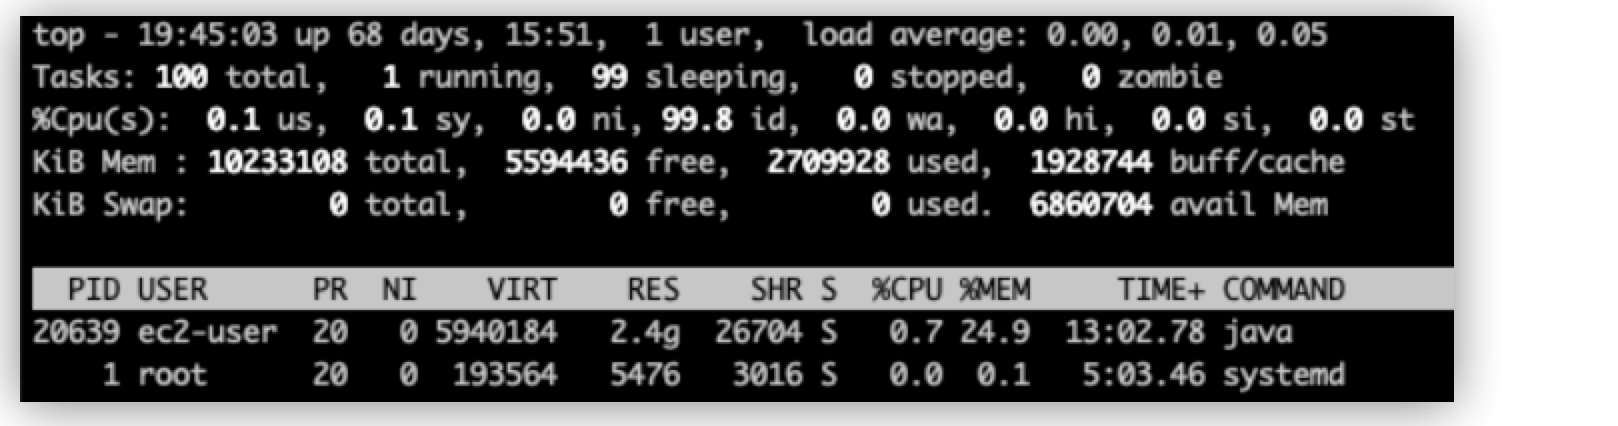
Top command:
top
The%CPUmetric equals to the CPU usage divided by the number of cores.
-
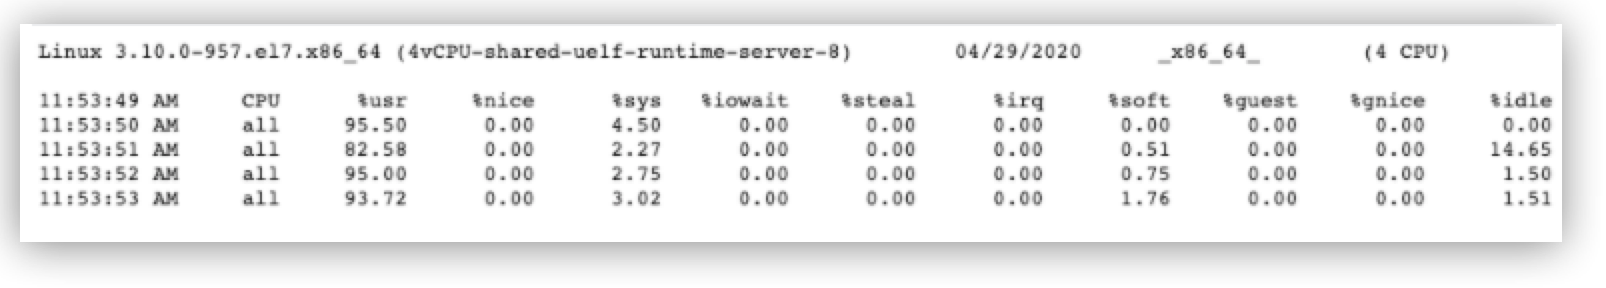
Sar command:
sar -u ALL $INTERVAL $COUNT
$INTERVALspecifies the time interval allocated for obtaining the metrics and$COUNTspecifies the number of data points to collect.
The main metrics to pay attention to are:-
%sys, which shows how much CPU is used at system level (kernel) -
%idle, which shows the percentage of time that the CPU was idle
-
Memory Resource
To understand how Mule uses memory, including heap and native memory or off-heap buffers, monitor the memory in any of several ways. Two of them are:
-
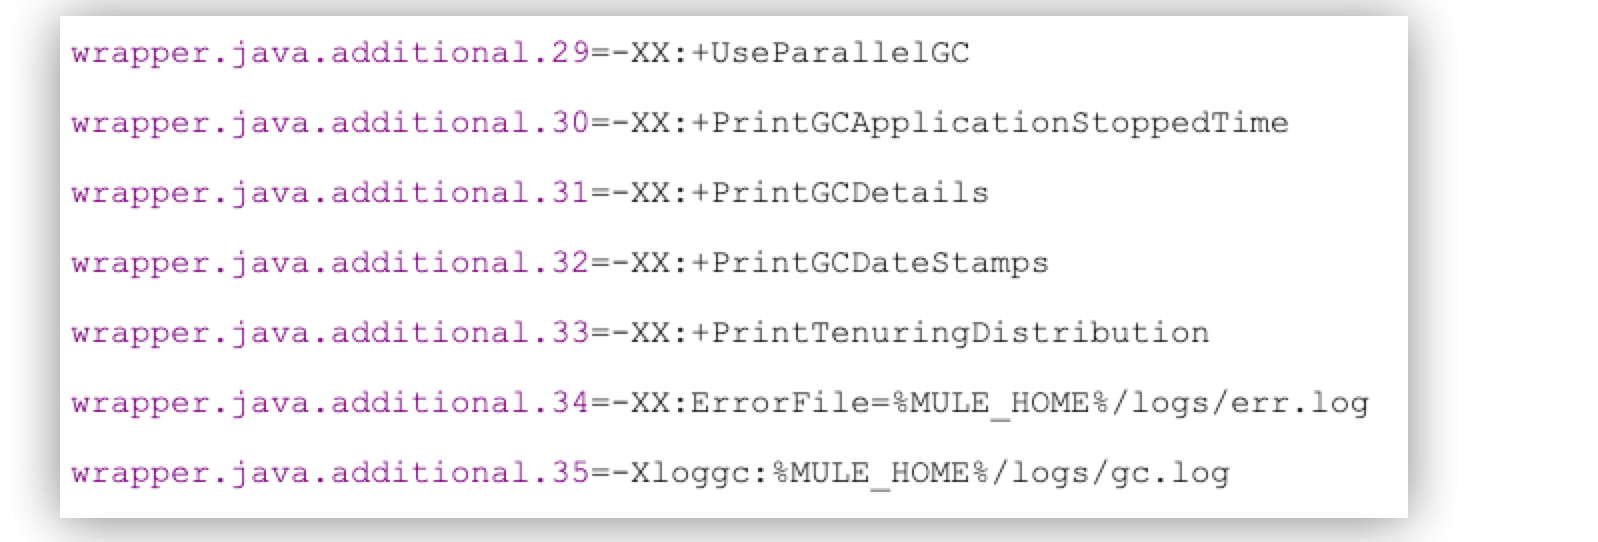
GC Log
Enable GC (Garbage Collection) logging to obtain allocation rate, object growth, and so on. Additionally, obtain information about the activities in the heap. Enabling GC logging involves a light disk overhead.
-
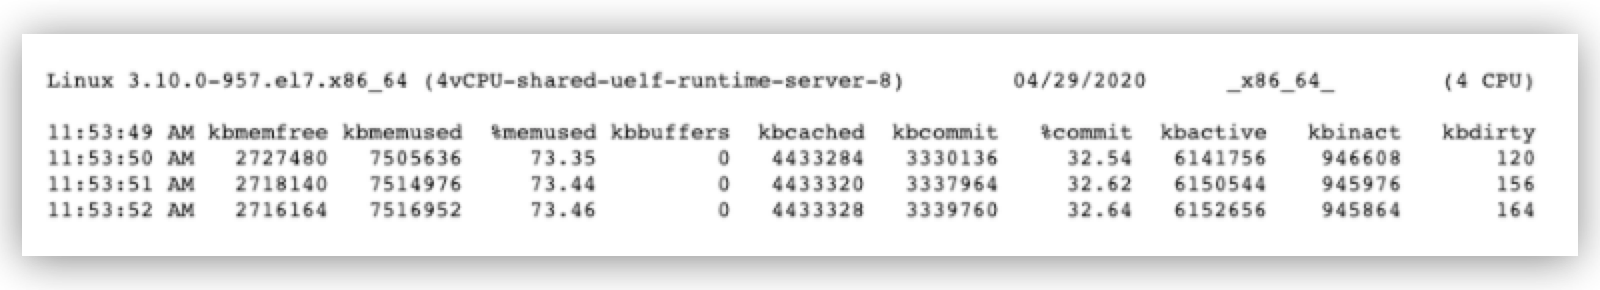
Sar command:
sar -r $INTERVAL $COUNT
The main metrics to pay attention to are:-
kbmemfree, which shows the amount of memory available, in kilobytes -
kbmemused, which shows the amount of used memory, in kilobytes -
kbcommit, which shows the amount of RAM or swap memory needed for the current workload, in kilobytes
-
Disk Resource
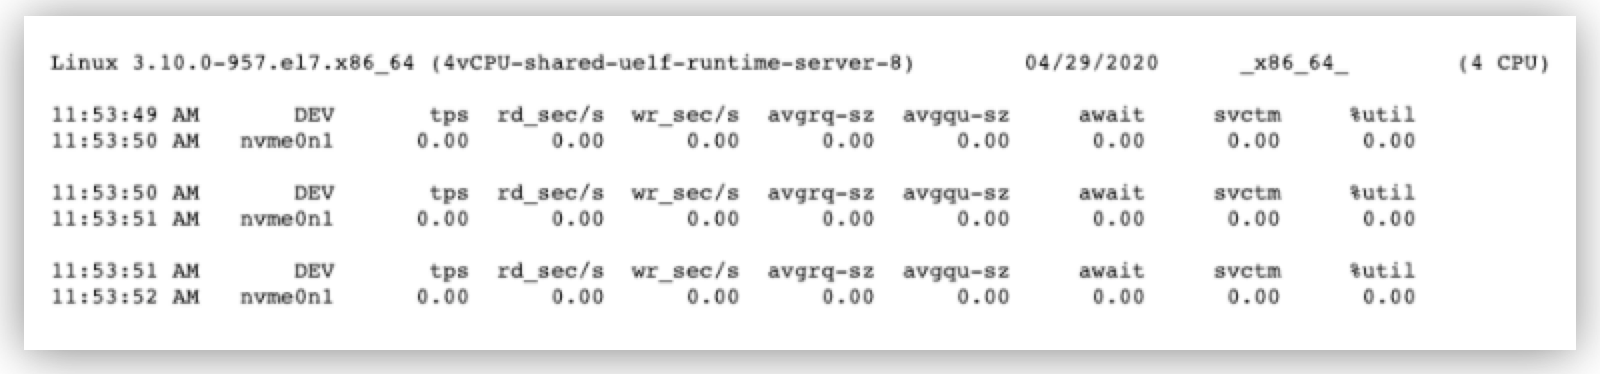
Some Mule components log writing operations and scenarios with large payloads treated as repeatable streams exhibit, where the exhausted resources are I/O (input or output) requests. Monitor the disk resource using the Sar command sar -d -p $INTERVAL $COUNT.
The main metrics to pay attention to are:
-
await, which shows the average time, in milliseconds for I/O requests issued to serve to the device to, which includes the time spent by the requests in the queue and the time spent servicing them. -
%util, which indicates device saturation by showing the percentage of CPU time during which I/O requests are issued to bandwidth utilization for the device.
Network Resource
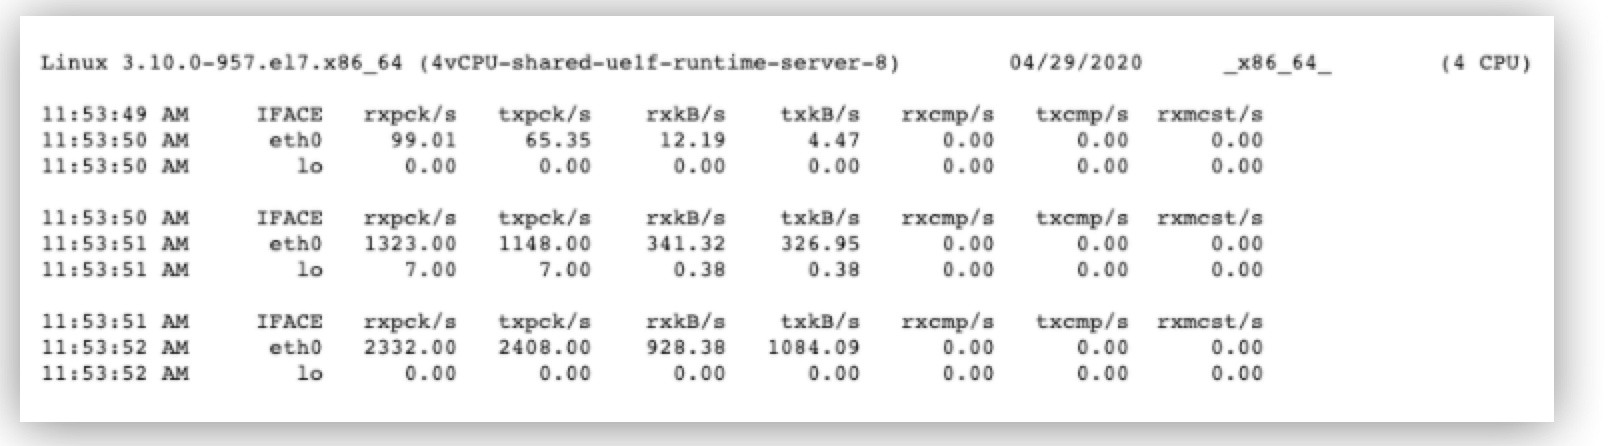
Because Mule connects several services communicating through the net, network use can become saturated and a bottleneck. To manage this, you need to know the available bandwidth and monitor the utilization. A simple way to do this is by using the Sar command sar -n DEV $INTERVAL $COUNT.
Main metrics to pay attention are:
-
rxpck/s, which shows the total number of packets received per second. -
txpck/s, which shows the total number of packets transmitted per second.
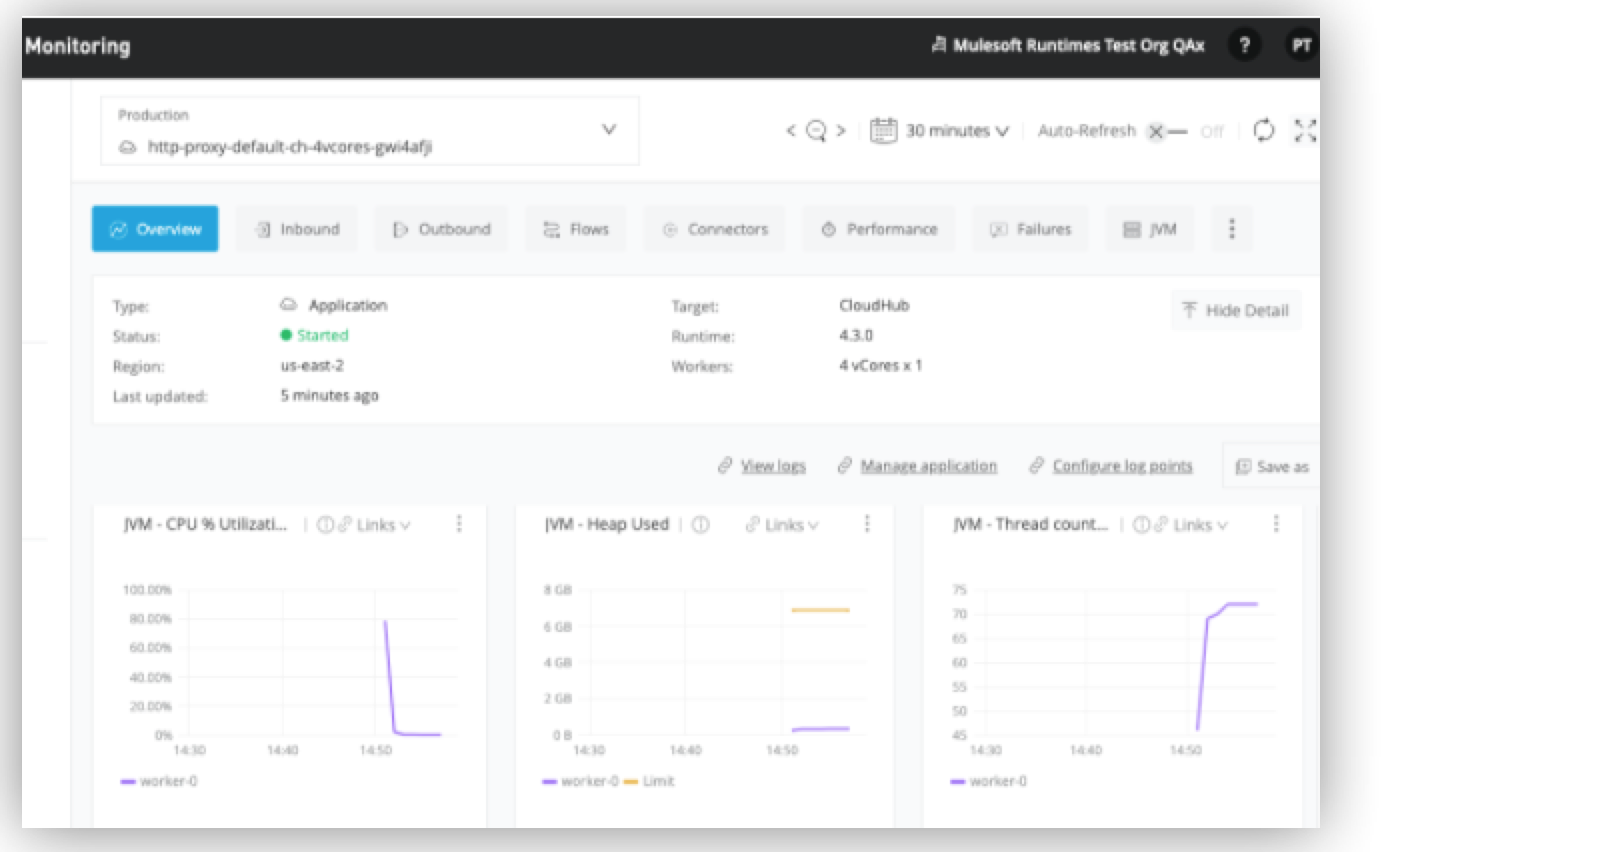
CloudHub Monitoring
You can use either the Anypoint Runtime Manager dashboard or Anypoint Monitoring to monitor Mule app performance in a CloudHub environment:
-
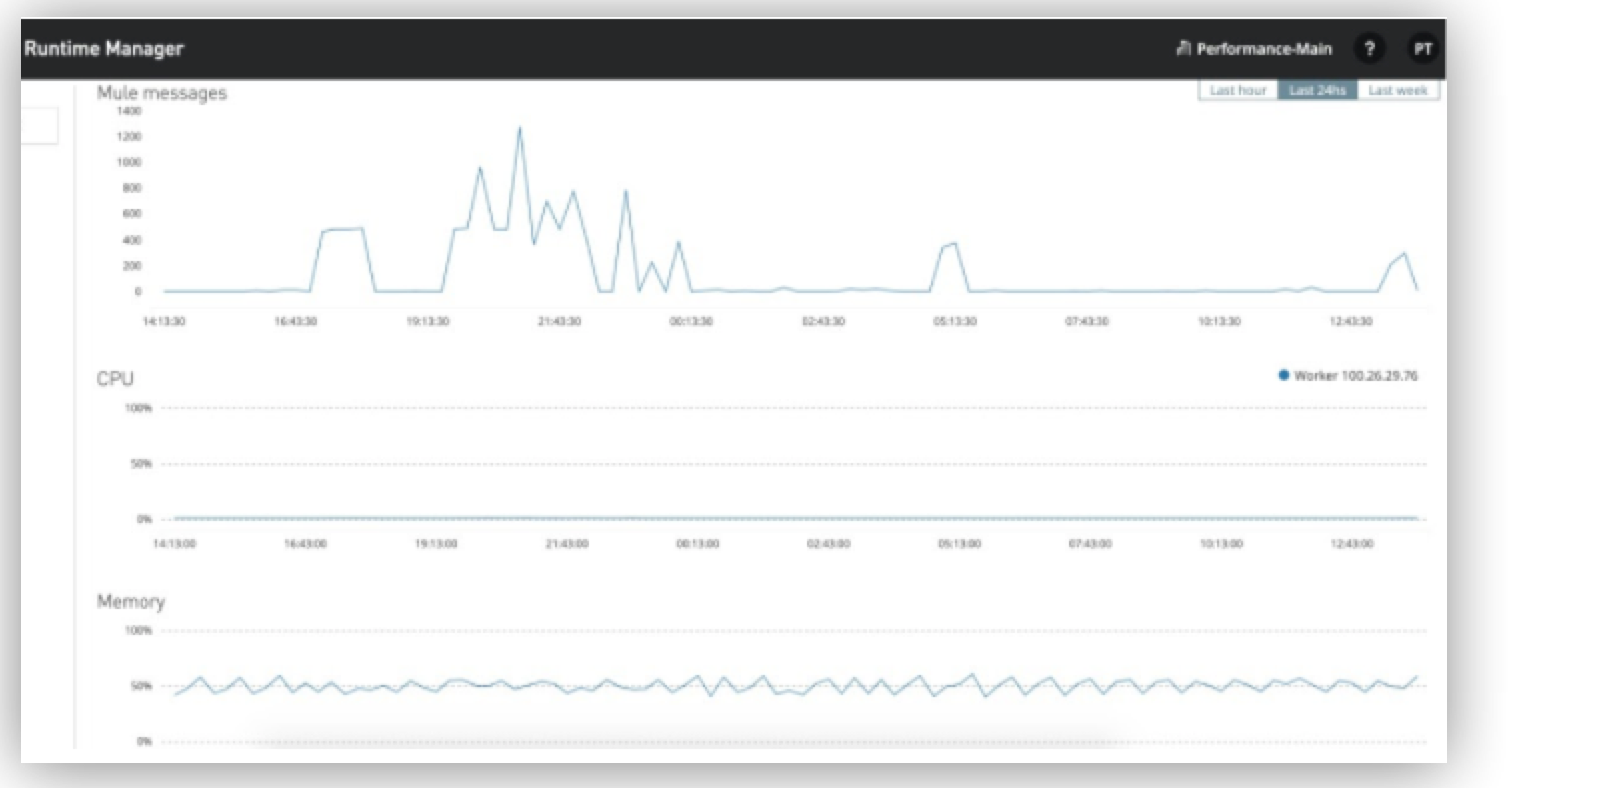
Runtime Manager dashboard
This tool enables you to visualize key performance metrics such as numbers of messages or transactions, CPU and memory use, and metrics during specific time periods, such as the past hour, the past 24 hours, or the past week.
-
Anypoint Monitoring
This tool enables you to track and visualize performance metrics by using built-in or custom dashboards showing visual representations of your resources. Additionally, Anypoint Monitoring enables you to detect anomalies, troubleshoot issues, and see trends that you might not notice by looking at raw data.