Viewing and Navigating Your Agent Network in Agent Visualizer
Explore an interactive map of agents, brokers, and Model Context Protocol (MCP) servers. Pan and zoom, filter by environment, toggle layers, and select nodes or edges to view detailed metadata, metrics, and links for deeper investigation.
Before You Begin
You need these Anypoint Platform permissions to access Agent Visualizer:
-
Monitoring: Monitoring Viewer
-
Exchange Viewer
-
API Manager View: View API Configuration
-
API Manager View: View Policies
Access Agent Visualizer
-
Log in to Anypoint Platform.
-
Click Agent Visualizer > Get Started.
On the Agent Visualizer page, you see the agent network map showing all discovered agentic assets, nodes and their relationships (edges).
If the page is empty, there are no discoverable agentic assets in Anypoint Exchange (Exchange). For more information about creating an agent network project and publishing assets to Exchange, see Create Agent Networks.
Navigate the Agent Network
Agent Visualizer provides an interactive view of your agent network where you can zoom in and out, click and drag on the canvas to pan the visualization, and turn on environment layers (production or nonproduction) to see additional views.
View and Toggle Data Flow Layers
Use data flow layers to switch the runtime view between production and sandbox environments. The base graph (assets and design‑time relationships from Exchange and broker definitions) stays the same; only instance‑level metrics change.
-
Leave the toggle on Production environments (default).
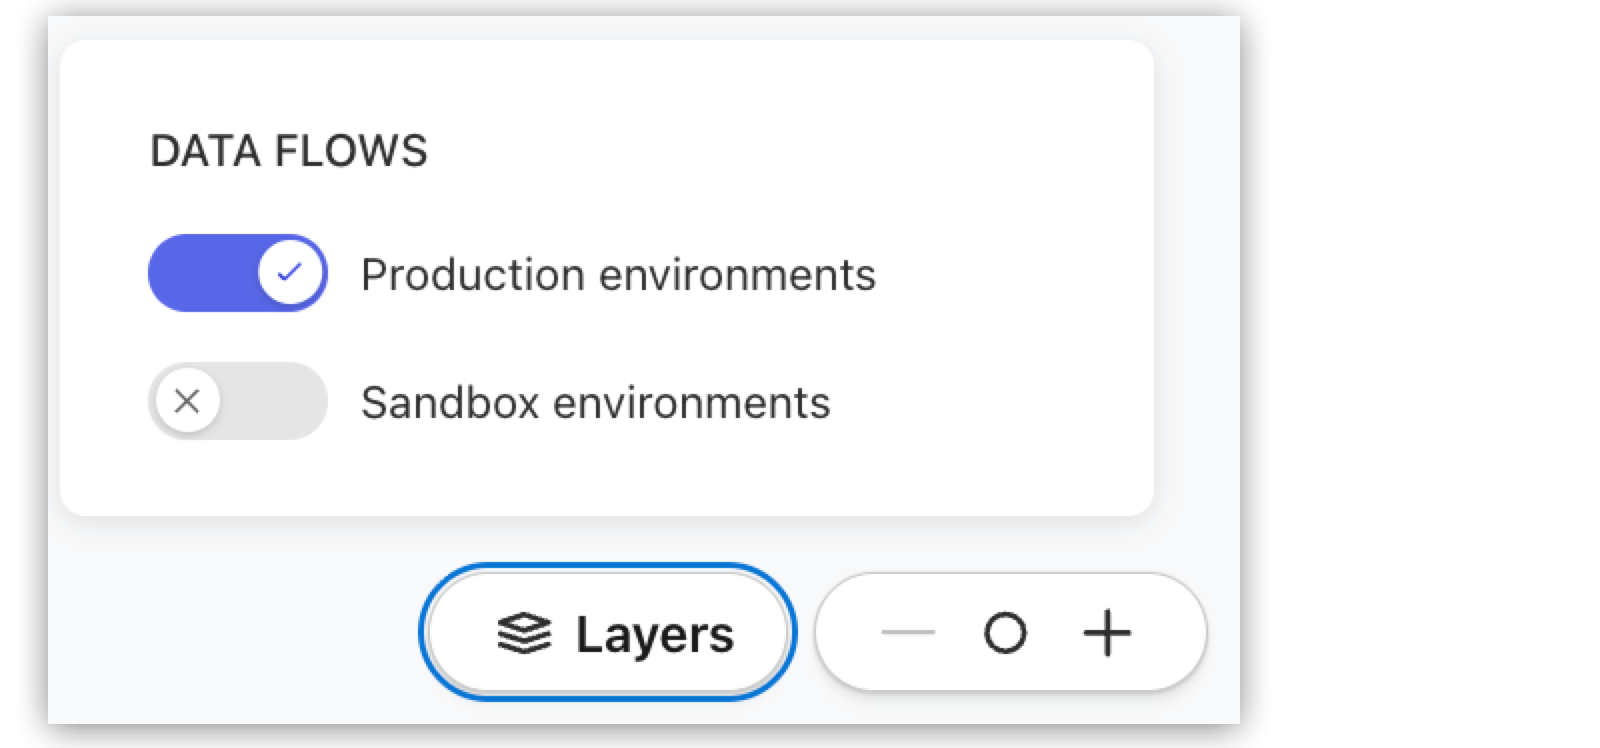
Production instances and their metrics appear on the existing nodes and edges.
-
Switch the toggle to Sandbox environments.
Sandbox instances and their metrics appear on the same nodes and edges. When viewing sandbox, production traffic lines are hidden and sandbox traffic lines are shown as solid edges.
For more information about the data flow layers, see Data Flow Layers.
View Node Details
When you select a node, a details card opens to provide comprehensive information for the asset.
| Agent Visualizer shows a maximum of 500 nodes. If you have more than 500 nodes, you won’t see all of them on the canvas. You can use search to locate specific nodes. |
-
Select any node in the agent network (or press Enter or Spacebar after focusing the node with arrow keys) to show its details card.
-
Review the node details.
For more information about the metadata you see for a node, see Node Details.
View Edge Details
The edge is shown as a solid line if traffic is observed between the nodes in the last 24 hours. The edge is shown as a dashed line if traffic is not observed between the nodes in the last 24 hours. See Edges for more information.
When you select an edge, the details card displays relationship information and metrics. Metrics are aggregated for all instances that exist between nodes.
-
Select an edge to open its details card.
-
Examine the traffic throughput per hour.
View External Agents and MCP Servers
External agents and MCP servers that are published to Exchange appear as nodes in the agent network. You can select these nodes to view metadata and, when available, instance details.
-
To open its details card and review the node’s metadata, select an external agent or MCP server node.
To visualize runtime edges for external agents, see View Agents Without Omni Gateway.
View MCP Server Edges and Tools
When agents invoke MCP servers, Agent Visualizer shows the relationship on the graph and lists MCP tools on the MCP server node’s details card.
-
Select an MCP server node to focus associated edges and open its details card.
Tool invocations from multiple agents are aggregated into a single list on the MCP server node.
-
Tools are ordered by throughput (total MCP calls).
-
The top 10 tools are shown by default.
Click Show More to see additional tools when available.
For tool visibility, the MCP server is present in Exchange and the egress path is protected by a managed Omni Gateway. This applies to MuleSoft‑hosted MCP servers defined in the broker network and externally hosted MCP servers defined in the broker network. The tools list reflects the selected activity period and shows only tools that were invoked during that window. Allowlisted tools that aren’t called don’t appear. If the MCP server exposes a tool catalog that Agent Visualizer can query, the details panel shows the full set of available (design‑time) tools alongside runtime usage.
-
-
To see traffic metrics on the connection, select the edge between the agent and the MCP server and open the edge details card.
Example: Visualize Interactions Between External Agents and MCP Servers
To visualize runtime edges for external agents and MCP servers that aren’t part of a defined agent network, publish them to Anypoint Exchange as agents or tools and route their traffic through Omni Gateway.
This example shows how to visualize the interactions between agents and MCP servers when they aren’t part of an agent network. This process manually "onboards" your external assets so they appear in the agent network graph as managed nodes with live traffic edges.
-
Publish your agents and MCP servers to Anypoint Exchange.
For more information about creating assets in Exchange, see exchange::to-create-an-asset.adoc#create-mcp.
-
Set up an Omni Gateway in Connected Mode.
To enable visualization, both the calling agents and the MCP servers are governed by Omni Gateway. By routing traffic through a gateway endpoint instead of calling the server directly, the gateway intercepts the request, injects identity headers, and reports the interaction to the Agent Visualizer.
For more information about securing agent interaction in Omni Gateway, see Securing Agent Interactions with Omni Gateway.
-
In API Manager, create a new instance for each MCP server.
-
Point the Implementation URI to the actual external URL of your MCP server.
-
Deploy these instances to your egress Omni Gateway.
-
-
Enable telemetry by injecting identifying headers for visualization (for example, source and destination identifiers).
-
In API Manager, go to the Policies tab for these instances.
-
Apply the Agent Connection Telemetry policy. This allows the gateway to parse MCP-specific traffic (like list tools).
-
Record the Consumer URL (the Omni Gateway endpoint) for each MCP server.
-
-
Publish the agent asset in Anypoint Exchange with the Agent type.
-
Set up the ingress Omni Gateway to handle the inbound traffic to the agent.
-
In API Manager, go to Agent and Tools Instances and select Add > Agent.
-
Assign the agent to the Ingress Omni Gateway.
-
Copy the Agent Instance ID.
The external agent uses this ID to identify itself to the Ingress Omni Gateway.
-
-
In API Manager, apply a Header Injection policy to the agent instance.
-
Add the Header Name as
x-agent-instance-idand the Header Value as the Agent Instance ID you copied earlier. -
Click Apply.
-
-
On the calling agent app, inject the
x-anypoint-api-instance-idheader (on list tools or call tools operations) providing the agent Instance ID from the ingress entry in API Manager as the value of the header.
View Agents Without Omni Gateway
Agents that aren’t protected by a managed Omni Gateway appear as standalone nodes. You can still view their metadata and understand their purpose in the network.
-
Select the agent node to open its details card.
Review metadata, tags, and any instance details available.
-
To visualize runtime edges and performance metrics, protect the agent with a managed Omni Gateway on the relevant path (ingress or egress), then generate traffic.
Search the Agent Network
Use search to locate nodes in the agent network. Search is case‑insensitive and supports multiple fields. Search results reflect the current base graph. The environment layer you select (Production or Sandbox) affects instance‑level metrics but not which nodes you can find with search.
-
Open the search box.
Show me how
-
Click the magnifying glass icon.
-
Use the keyboard shortcuts:
-
Mac: Cmd+Shift+k
-
Windows: Ctrl+Shift+k
-
-
-
Enter your search terms.
You can search by:
-
Display name
-
Asset type, for example, broker, agent, MCP
-
Platform, for example, MuleSoft, Agentforce, AmazonBedrock
-
Exchange tags
Smart suggestions show up to 10 results, ordered by relevance, with Type and Platform badges and an indicator of the matched field.
-
-
To zoom in on the node and open its details card, select a result.
-
To clear the results and close the search box, press the escape key.
Add Filters
Use filters to control which parts of the network you see on the canvas. Filters help you focus on the information you need in large graphs by limiting the scope to specific business groups and time windows.
The agent network graph shows assets that belong to the selected business groups, and the same map shows edges between those assets (including cross‑business group connections).
Metrics on nodes and edges are aggregated based on the business groups you select. When you deselect business groups, metrics update to reflect only the remaining selection.
Apply Filters to the Agent Network
-
Open the filter panel and select the filters to apply:
-
Business Groups
By default, your current business group is selected. You can select multiple business groups to see cross-business group connections in a single view. Only business groups you have Agent Visualizer permissions for appear in the list.
When you select multiple business groups, the canvas shows assets belonging to the selected business groups and edges between those assets across all selected business groups. Metrics are aggregated across all selected business groups. When you deselect business groups, metrics update to reflect only the remaining selection.
If performance degrades when viewing multiple business groups at once, reduce the selection, use search, or zoom to areas of interest. -
Environment
Select Production or Sandbox.
-
Activity Period
Select the last: 24 hours 3 days 5 days 7 days
-
Display Options
You can hide standalone nodes and edges.
-
-
Click Apply Filters.