Viewing Logs and Errors
 Cloud IDE
 Desktop IDE
Anypoint Code Builder provides two ways to view logs and errors:
-
ACB Logs tab: A centralized view that consolidates warnings and errors from all Anypoint Code Builder extensions into a single, filterable panel. Use this view to quickly identify and troubleshoot issues.
-
Output panel: Displays detailed, raw logs from individual extension channels. Use this view for in-depth investigation when you need complete log output.
View Errors and Warnings
The ACB Logs panel provides a centralized view of all warnings and errors generated by Anypoint Code Builder. This panel consolidates logs from multiple extension channels into a single, searchable interface.
To open this panel, click the ACB Logs tab in the Panel area, alongside other tabs such as Output, Problems, and Debug Console.
The panel displays log entries in a table with the following columns:
| Column | Description |
|---|---|
Date |
Timestamp of when the log entry was recorded. |
Log Level |
Severity of the log entry (Error, Warning, Info). |
Extension |
The Anypoint Code Builder extension that generated the log. |
Message |
The detailed text of the log entry. |
Project |
The name of the project related to the log entry. |
Filter and Search Logs
Use filters to narrow down the log entries displayed:
-
Level: Filter by log severity (Error, Warning, Info).
-
Source: Filter by the extension that generated the log.
-
Date: Filter by date range.
To search for specific text within the logs, use the search bar.
Expand Log Details
Click a log entry to expand it and view additional details, such as the full stack trace.
Export Logs for Troubleshooting
When you export troubleshooting information using the MuleSoft: Export Troubleshooting Information command, Anypoint Code Builder automatically includes the logs in the exported file. For more information, see Export Troubleshooting Information.
View Detailed Logs in the Output Panel
For in-depth investigation, use the Output panel to view raw, detailed logs from individual Anypoint Code Builder extension channels.
To open and configure the Output panel:
-
Open the Output panel using one of these methods:
-
Use the keyboard shortcuts: Cmd+Shift+u (Mac) or Ctrl+Shift+u (Windows)
-
In the desktop IDE, select View > Output.
-
In the cloud IDE, click the
 (menu) icon, and select View > Output:
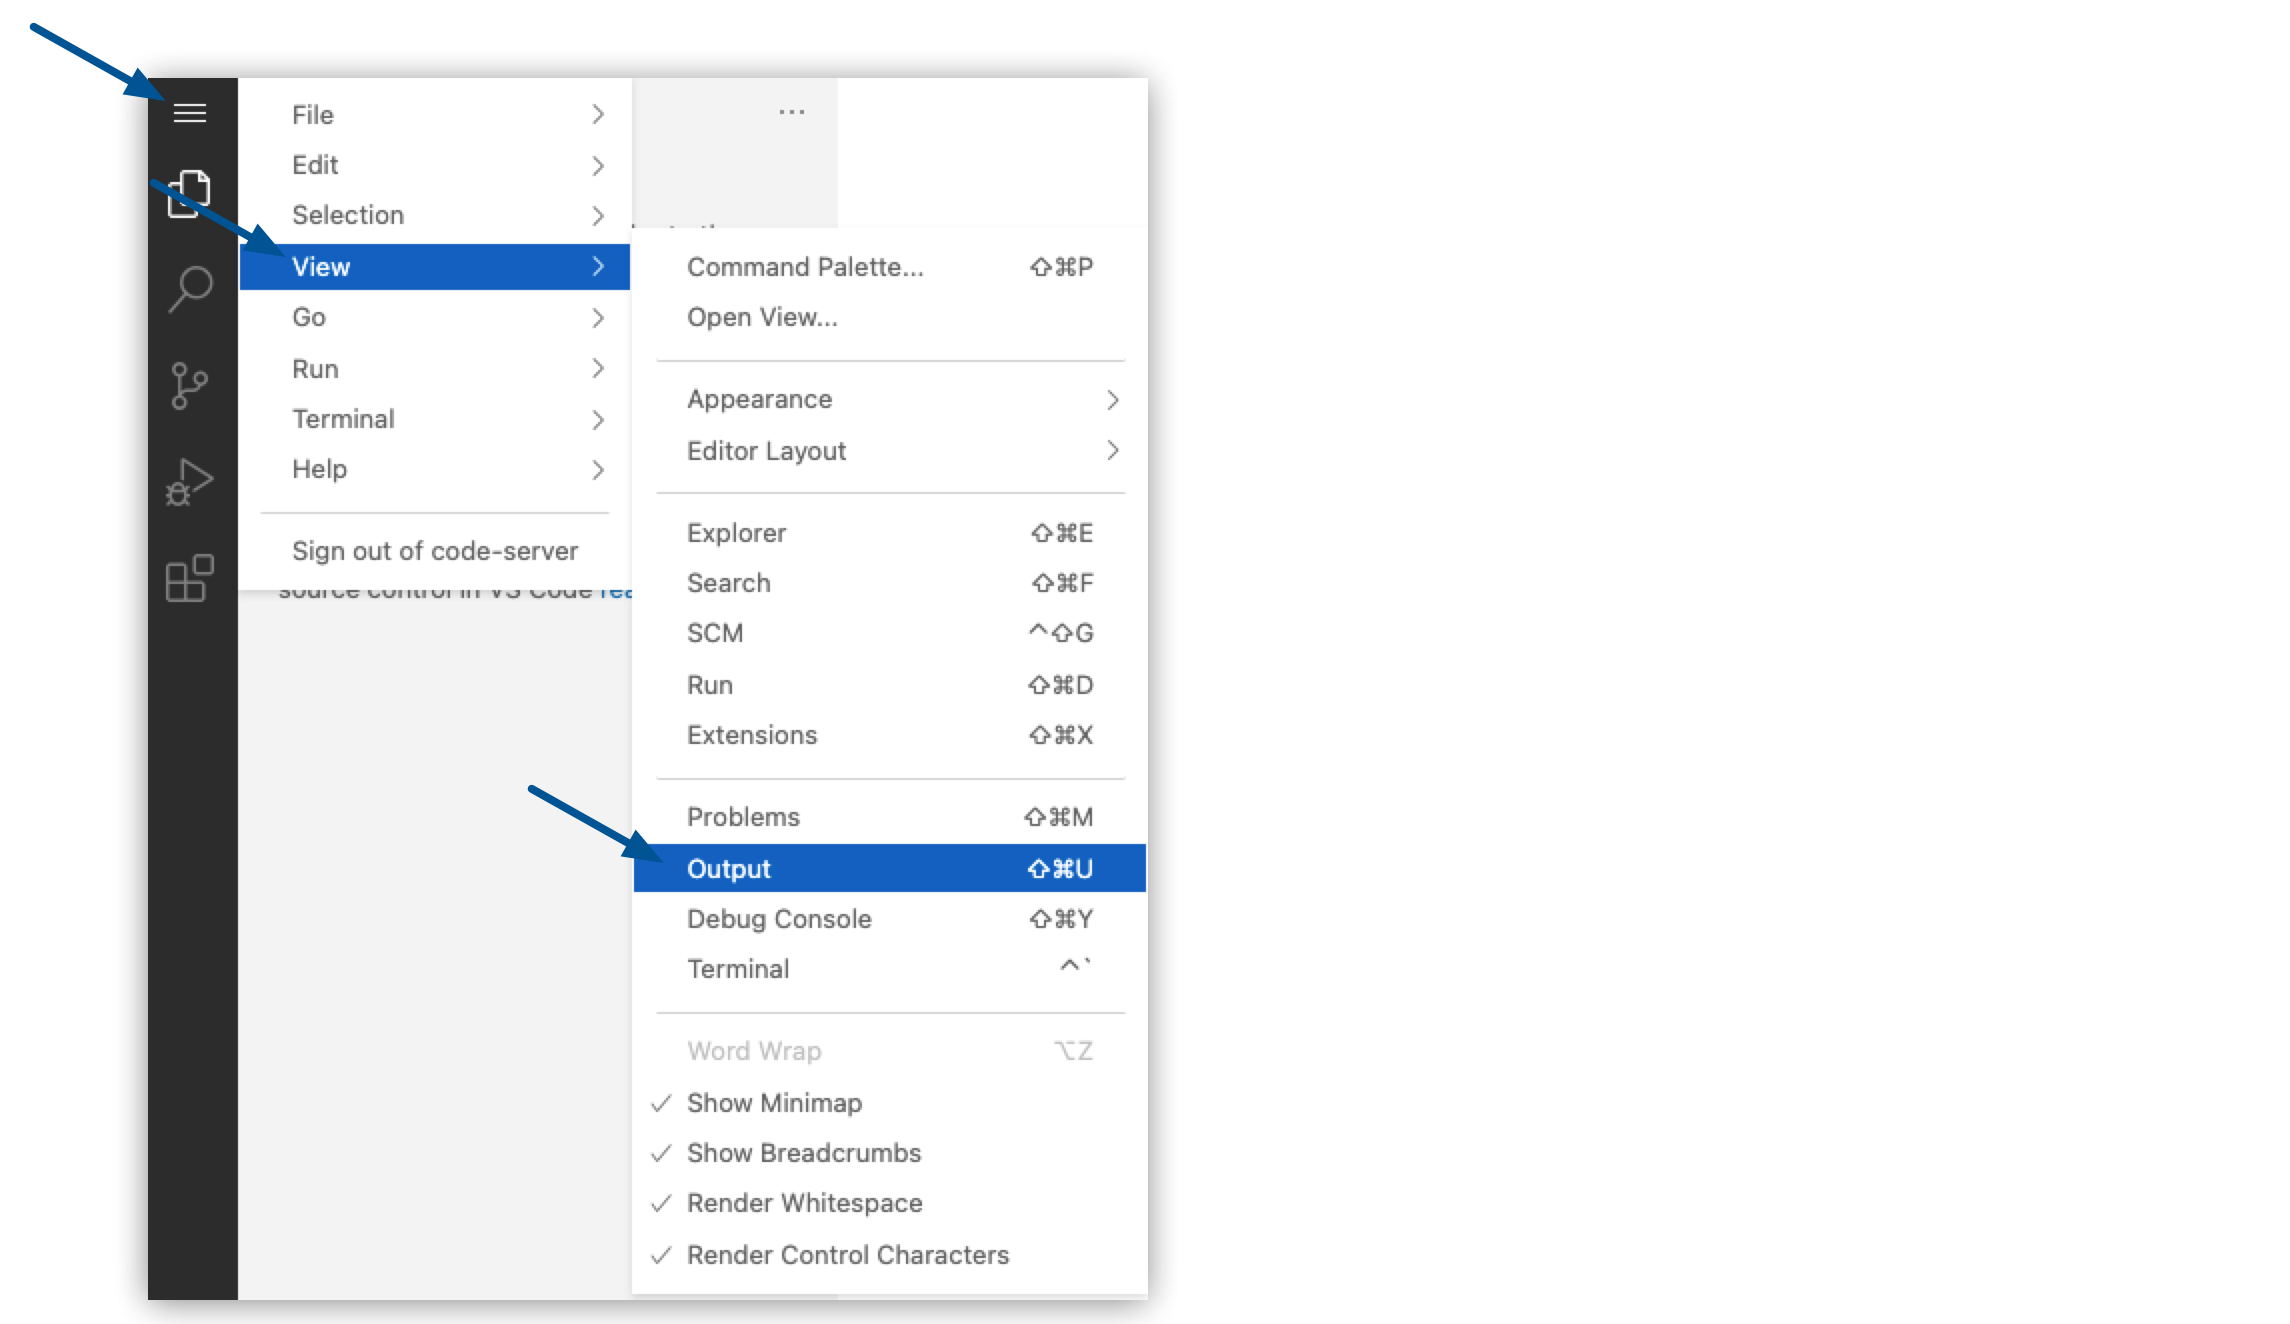
-
-
In the Output panel, select an output channel from the dropdown list:
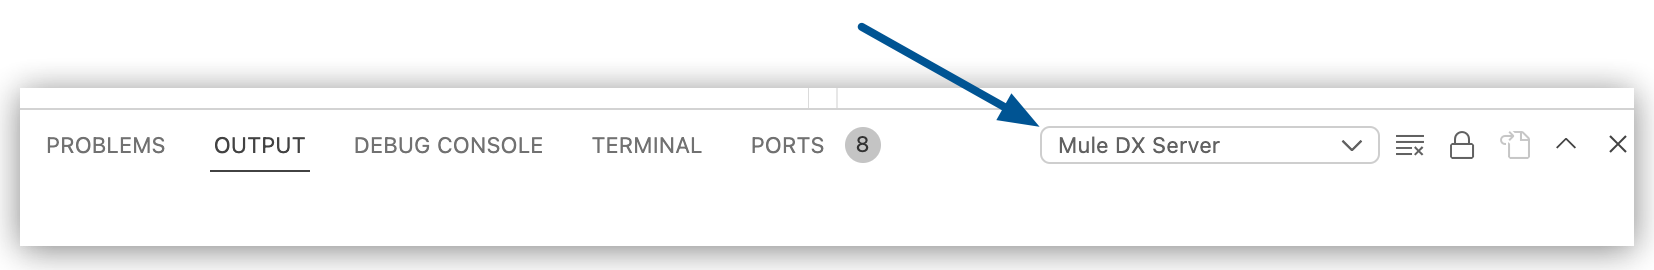
Common channels include:
-
Mule DX Server: General logs from the Anypoint Code Builder backend.
-
Mule DX Server: Scaffolding: Logs specific to project scaffolding operations.
-
The Output panel displays the complete log stream for the selected channel, which is useful for debugging complex issues that require full context.