Troubleshooting Bots
If a bot has status OK, but seems not to work properly, download its log files or restart the bot.
If the bot has status SUSPENDED, review the execution plans.
If a bot has status STOPPED, OVERDUE, or UNKNOWN, an IT administrator needs to log on to the computer the bot is installed on and needs to troubleshoot it there.
If a process execution fails when a bot runs correctly, turn on debug logging to get help detecting the cause.
View the Planned Process Executions
If you’re not sure why a bot isn’t processing, review the execution plans:
-
In the module Bot Management, open the view Bot Execution Plans.
-
In the table, click Execution timetable (
 ) in the row of the bot you want to check.
The execution timetable shows the effective runtime of all calendar scheduled run configurations assigned to the bot. The execution timetable does not show run configurations using other types of scheduling, such as on-demand, interval or cron-expression.
-
Click Configure Execution Timetable (
 ) to change the time interval of the table and to select the shown configurations.
 -
Click OK.
-
In the Execution Timetable, click a colored bar in the row of the configuration you want to check to view the composition of the effective runtime. The bot runs a process when the bot’s service time overlaps with the configuration schedule. If the process uses applications, the bot doesn’t run the process during the downtimes of any of those applications.
RPA Manager displays all times in your local time. Times from bots and applications living in other time zones are converted to your local time. Hover over the bars to see which service times, downtimes, and schedules are contained in the execution times.
Example of the Effective Runtime Composition
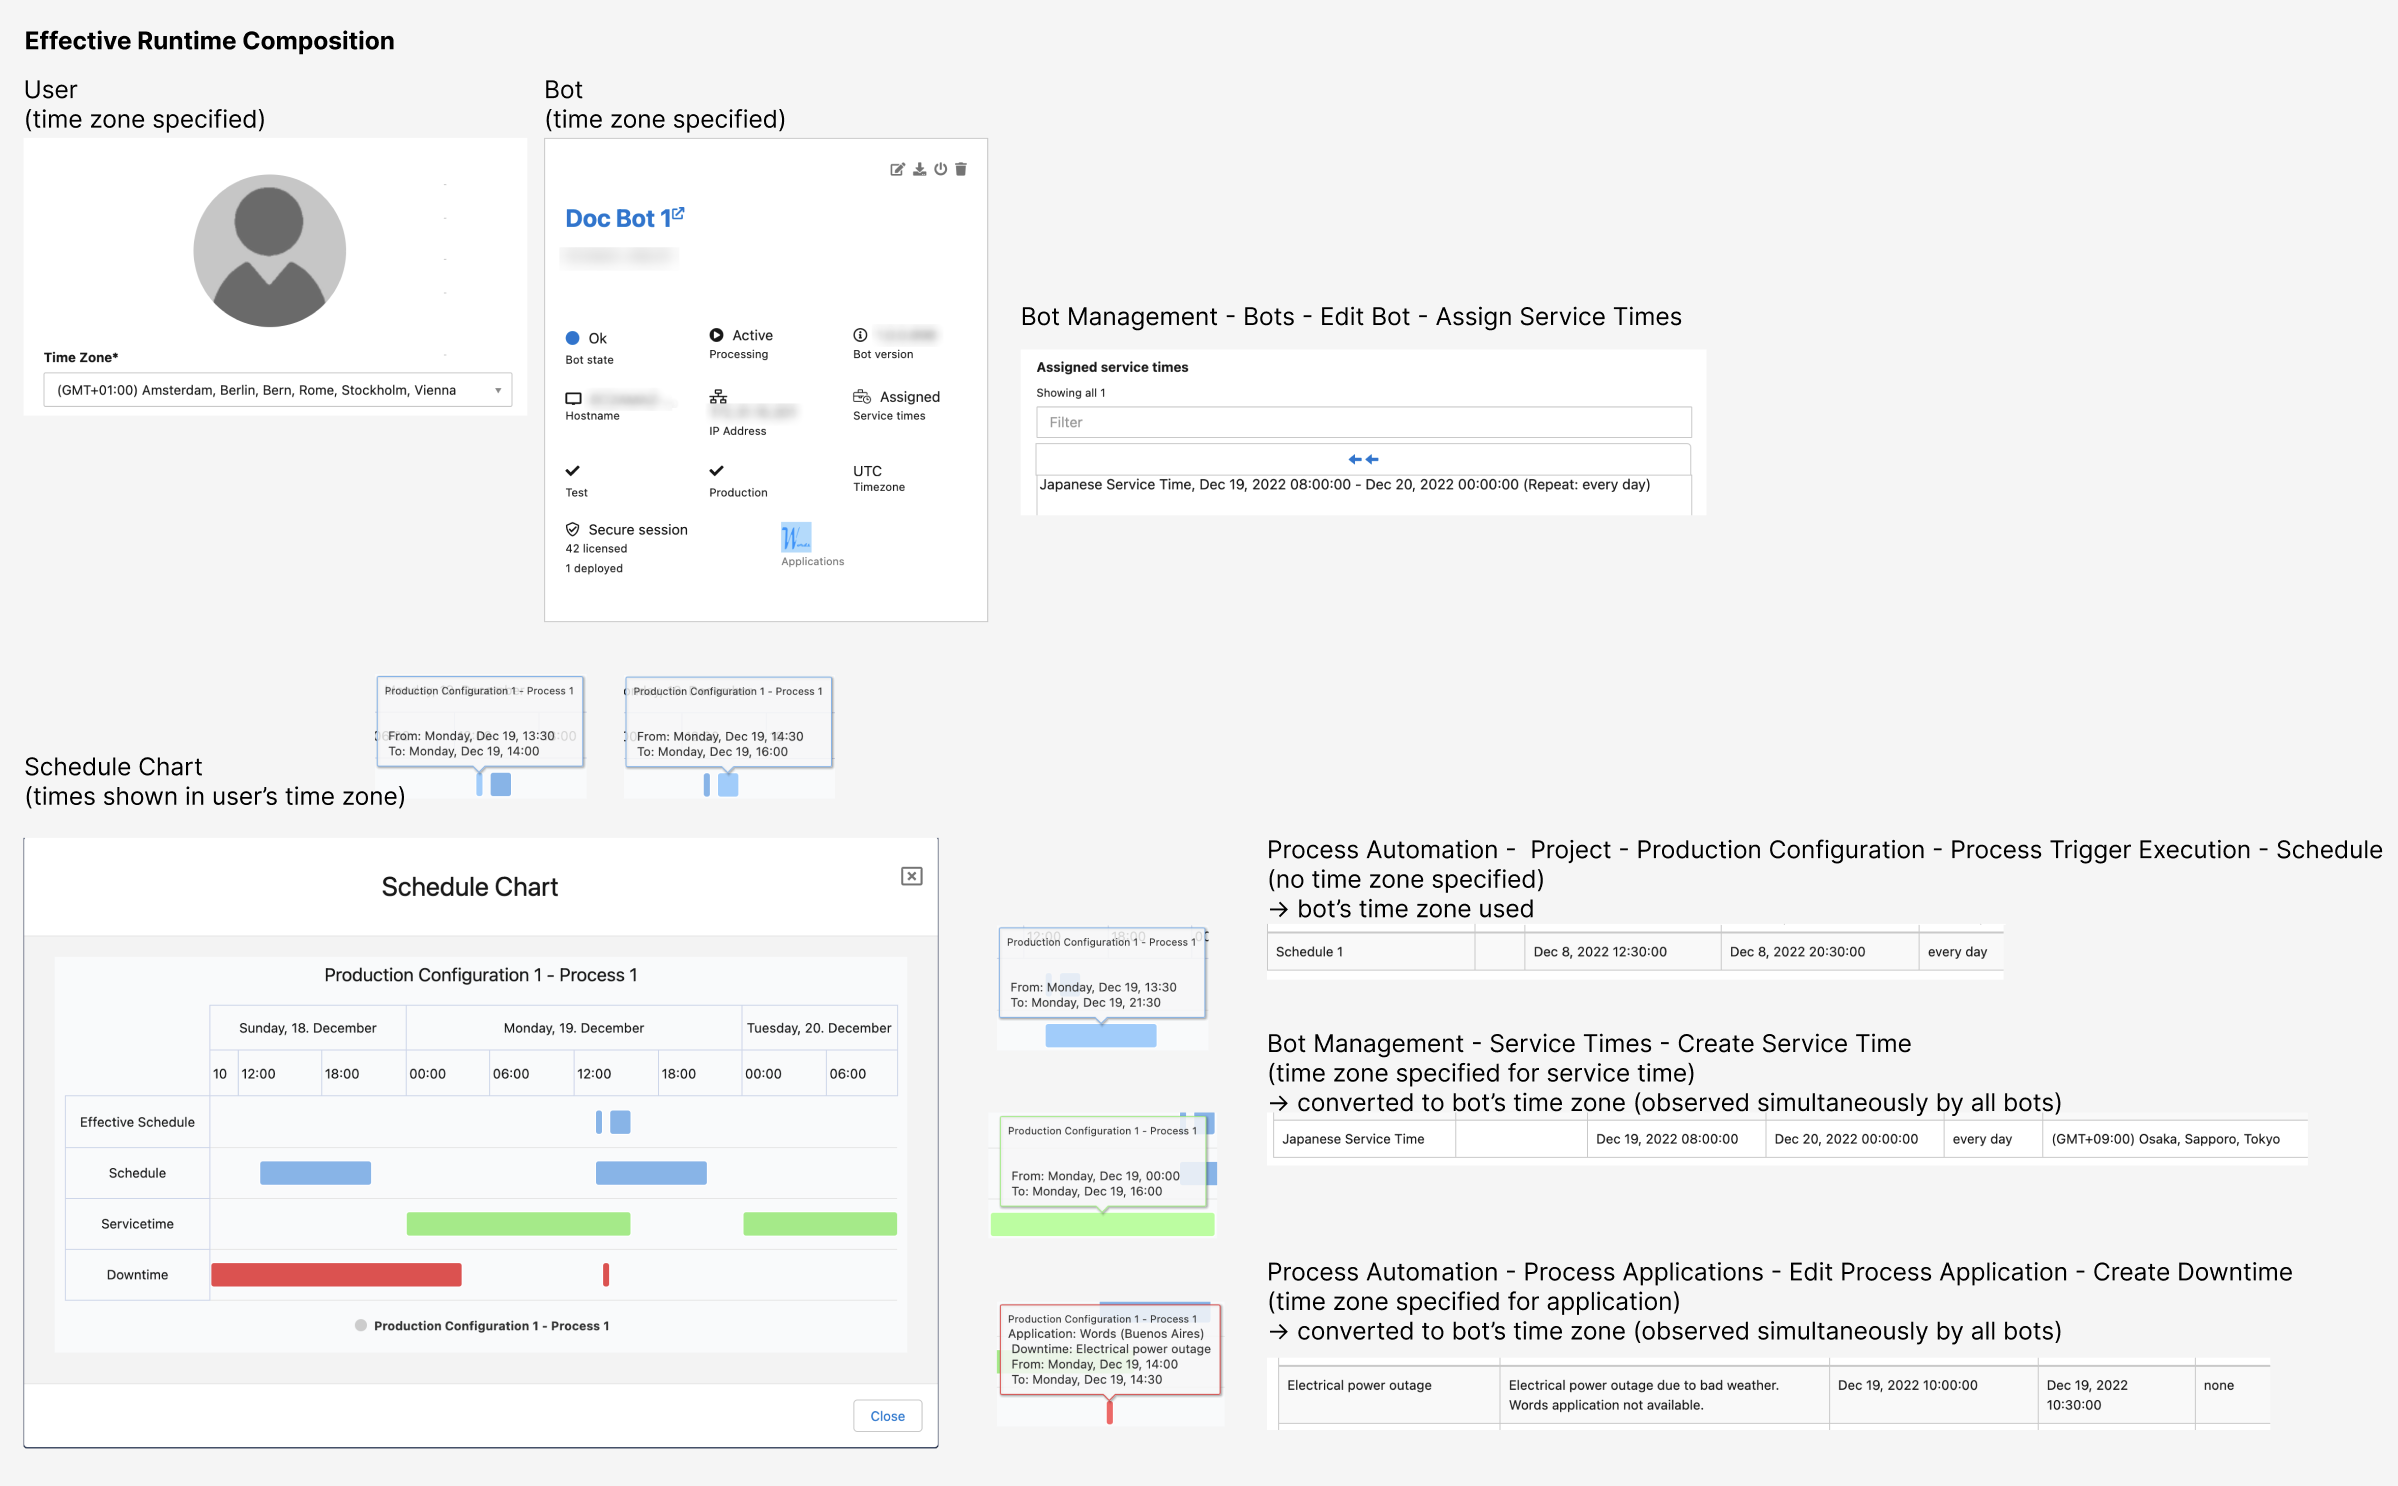
This example shows the planned process executions from the view of a user who lives in Rome (GMT+01:00). All shown times are converted to the user’s time zone.
The production configuration uses a schedule that is repeated daily from 12:30 PM to 20:30 PM regardless of time zones.
The bot is installed on a computer that uses the UTC timezone. It has an assigned service time defined in Japanese time (GMT+09:00).
The process uses an application installed on a computer in Buenos Aires (GMT-03:00). There was a power outage during which the application was down from 10:00 AM until 10:30 AM.
When schedules and service times overlap and no used applications is down, the bot executes the process.
In this example, a downtime takes place in the middle of the scheduled time. The execution is interrupted during that time. Because the service time ends before the scheduled run time, the effective runtime is shortened.
As you can see in the Schedule Chart, the service times and the downtimes are converted to the bot’s timezone. They are observed simultaneously across all time zones. The bots interpret the schedule to be valid for their own time zone. It is observed at different times across all time zones.
Learn how to manage service times.
Learn how to manage applications.
Learn how to create production and invocable configurations.
View the Bot Log Messages
The bot log messages contain detailed information about a process run. RPA Manager lists each bot activity with information about the run result and displays bot messages contained in activities under Additional Customer Info.
To view the bot log messages:
-
Open the Process Run Statistics view in the Bot Management.
Alternatively, in the Process Automation module:
-
From within a project in the test or production phase, click on a run result number in the Run Results panel.
-
-
Click Bot Message Log (
 ) in the table row of the bot you want to read messages from.
Bot messages might be concatenated and truncated. To view the complete bot log, download the log files.
Download the Log Files of a Bot
Download the zipped bot log files to check for error or warning messages or to view screenshots.
The package contains the folders BotTrace and RpaBotLogfiles. The trace folder contains the log files of the Secure Sessions, while the log files folder contains the installation and configuration data, as well as the execution log of the bot.
This option is only available when the bot has the status OK.
An IT administrator can configure the content of the package in the RPA Bot Configurator on the computer where the bot is installed.
-
Open the Bots view of the Bot Management module.
-
Click Download Logfiles (
 ) in the row of the bot you want to read the log files from.
 -
Extract the contents and view the relevant files.
Turn On Debug Logging
Debug Logging is supported by RPA Bots with version 1.3.4 and later.
If a process execution fails when a bot runs correctly, turn on debug logging for at least the time span of the next process run to get help detecting the cause.
Then download the log files of the bot and send them to the support team if you need help analyzing the cause of the failure.
To turn on debug logging, complete the following steps:
-
Open the Bots view of the Bot Management module.
-
On the panel of the bot to debug, click Turn on debug logging (
 ).
). -
In the Enable time limited debug logging window, enter a time interval in minutes and click Start debug logging.
After the time interval lapses, the log level returns to the default.
If a user sets a new debug interval while the bot is still in debug mode, the interval restarts with the new value. You cannot see the interval for which the bot is in debug mode or if it is in this mode.
Restart a Bot
Use this function to restart a bot to ensure that all the processes the bot is currently executing are completed properly before the bot is stopped.
Before a process is started, the bot has to check a variety of conditions. For example, whether it’s within its assigned service time and whether all the applications that the process needs for execution are available.
The bot divides these tasks, which are independent from one another, into threads, which can run simultaneously (asynchronously). The bot then waits until all the tasks are complete and then either continues with starting the process or checks the conditions again.
In rare cases, an individual thread might have an error due to unforeseen circumstances, but can’t report it back to the bot. In this case, the Bot remains in wait status and can’t execute any more processes.
The latter might be the case when the bot has the status OK and a deployed process is within an effective runtime interval, but no process has been started for several minutes.
When you restart the bot, the bot and all of its threads are initially stopped after the bot has completed the pending tasks. The restart is then performed in a clean environment, which means the problem should no longer occur.
Restarting a bot only works if that bot has the status OK. Otherwise RPA Manager places the restart in the task list and executes it as soon as the bot is OK again.
-
In the Bots view of the Bot Management module, click the Restart icon in the row of the bot you want to restart.
-
Wait a few seconds and refresh the browser to see the effect.