Getting Alerts
Create and receive alert notifications for your deployed resources (Mule apps and APIs).
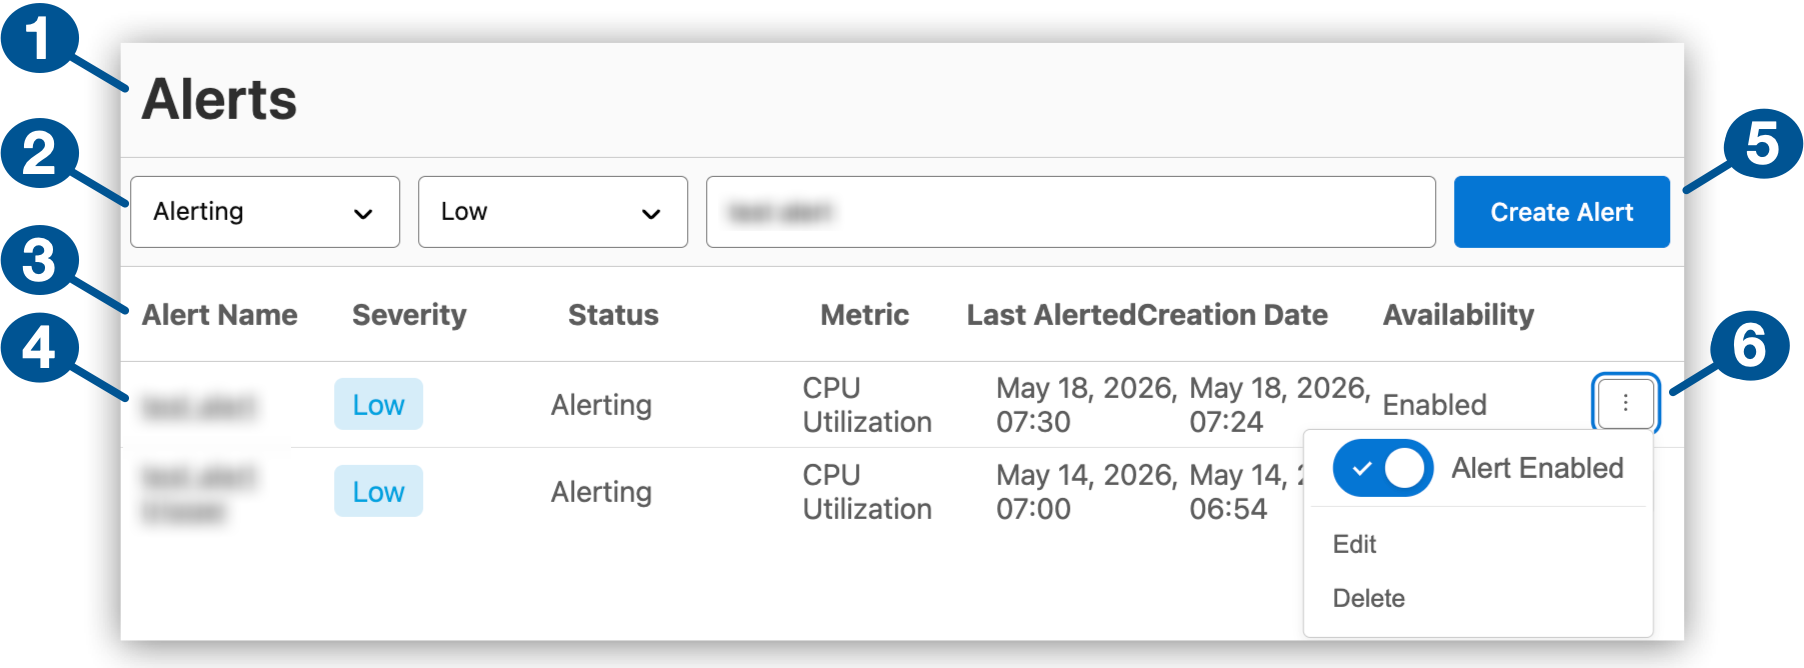
| 1 | Alerts in Anypoint Monitoring |
| 2 | Search filters: |
| 3 | Alert properties |
| 4 | List of configured alerts
Each alert name opens to more information about the alert, including the alert threshold and recipients of alert notifications: 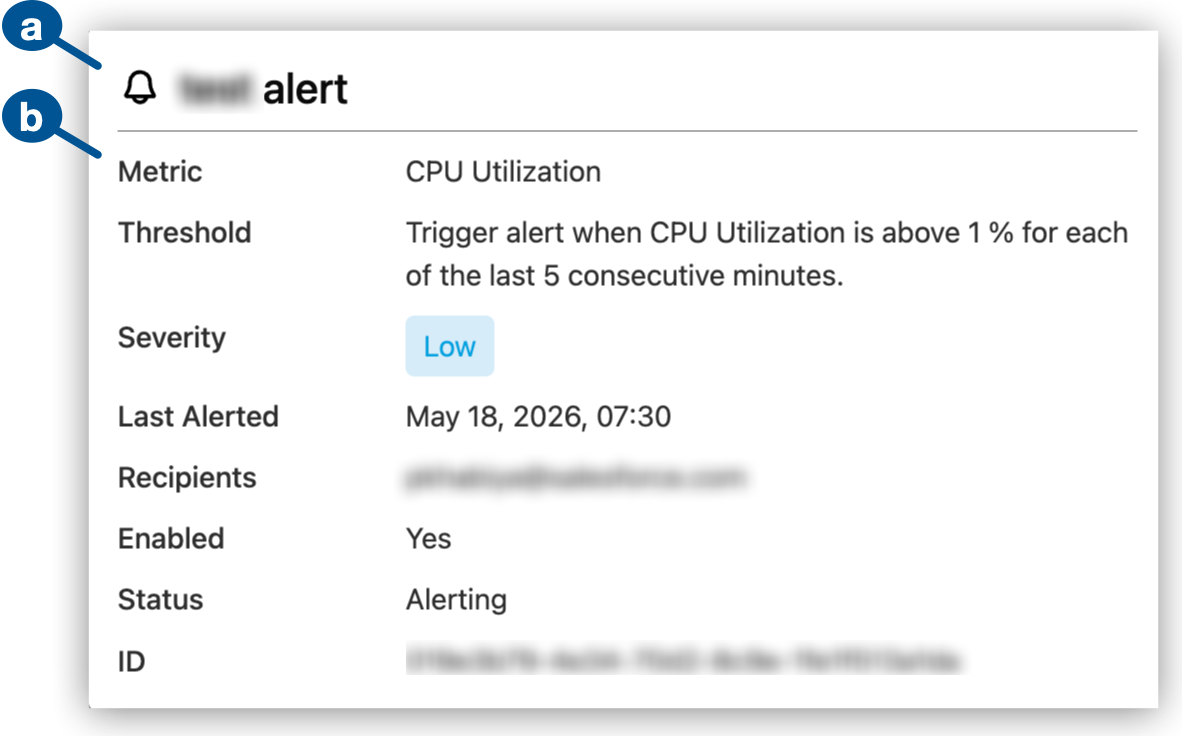
|
| 5 | Create Alert is for configuring a new alert. |
| 6 | Enable, disable, edit, or delete an alert from its |
For alerts in custom dashboard graphs (US and EU clouds only), see Alerts.
Before You Begin
Required prerequisites:
-
Your organization must subscribe to a tier in an Anypoint Platform cloud that supports this feature.
-
You must have the permissions required for viewing or managing Anypoint Monitoring.
-
At least one Mule application or API must be deployed to a supported host:
-
Mule application:
-
CloudHub 2.0
-
Runtime Fabric
-
-
API managed by Mule Gateway or Omni Gateway
-
For information about deployment targets for Mule applications, see Runtime Plane Hosting Options.
Find Alerts
To find the list of alerts:
-
In Anypoint Monitoring, navigate to Alerts.
-
To narrow the list of alerts, use any of these filtering options:
-
Review the list of alerts.
Each alert provides:
-
Alert Name: Name of the alert
-
Severity: Configured severity of the alert
-
Status: Current status of the alert
-
Metric: Name of the metric that the alert uses
-
Last Alerted: Most recent date and time the alert triggered or - for an alert that has never triggered
-
Creation Date: Alert creation date and time
-
Availability: Enabled or Disabled alert setting
-
Create an Alert
Configure an alert, the condition for triggering the alert, and the alert notification.
-
From Alerts in Anypoint Monitoring, click Create Alert.
-
Configure alert properties:
-
Provide a name for the alert.
-
Select the environment in your organization for this alert.
-
Select the resource type and resource that the alert is for. Only active resources that can receive traffic are available.
-
Resource Type: API or Application
-
Resource Name: Name of the API or Mule application
-
-
For an API alert, select an API version and up to ten response codes.
-
Click Next to open Set Alert Condition.
-
-
In Set Alert Condition, configure the rule for triggering the alert:
-
In Configure Notifications, configure the message to send when the alert triggers.
To use variables in your email notification, see Email Notification Variables.
-
Provide a subject.
-
Provide the message.
-
Identify recipients.
The first recipient appears in the email To field, and the remaining recipients appear in the CC field.
-
Enable, Disable, or Delete an Alert
Alerts are enabled by default when they are created. You can disable, re-enable, or delete an alert.
-
In Anypoint Monitoring, navigate to Alerts.
-
Find the alert in the Alerts table.
-
Click the alert’s
 (More menu).
 -
Enable, disable, or delete the alert.
Alert Statuses
The Alerts page indicates whether an alert is currently triggering or in some other state.
- No data
-
No data is available in the series to evaluate the alert threshold.
- Paused
-
The alert is disabled and no longer active.
- Alerting
-
The value of the metric passes the specified threshold.
- OK
-
The value of the metric has not passed the threshold.
- Pending
-
The alert is enabled and waiting for evaluation.
Alert Severities
Use your organization’s alerting criteria when setting an alert’s severity. Available severity levels are:
-
Low
-
Medium
-
High
-
Critical
Alert Thresholds
Alert threshold configurations indicate when the data collected on a metric triggers the alert. Configurations for alert thresholds follow this form:
| Configuration Pattern | Example |
|---|---|
Trigger alert when selected metric is Above|Below|Above or equal to|Below or equal to|Equal to Number for each of the last Number consecutive minutes. |
Trigger alert when selected metric is Above 4 for each of the last 10 consecutive minutes. |
The example configures an alert to trigger when the selected metric (such as Message Count) is Above 4 for 10 consecutive minutes. In other words, the count must exceed 4 for each minute of minutes 1-10. If the count exceeds 4 for 9 of 10 minutes, but not the tenth minute, the alert doesn’t trigger, even if the count exceeds 4 at minute 11. Following the same criteria, if the count exceeds 4 for each minute of minutes 11-20, the alert triggers.
Alert Metrics
A Mule application or API metric is part of the configuration for triggering the alert.
Mule app metrics:
-
Message Count: Total number of Mule messages that process successfully
-
Message Error Count: Number of Mule messages that return an exception in a flow
-
Average Response Time: Response time (in milliseconds) of a message
-
CPU Utilization: Percent of CPU used on the virtual machine
This metric includes all processes and is available only for apps deployed to CloudHub or Anypoint Runtime Fabric.
-
Memory Utilization: Percent of heap used
This metric is available only for apps deployed to CloudHub or Anypoint Runtime Fabric.
Anypoint Monitoring tracks heap usage and triggers memory alerts based on the value of
heap_used/heap_total. Note thatheap_totalisn’t identical to the maximum heap memory allocated to the Mule app on CloudHub. For example, 0.2 vCores indicates that the maximum heap memory is 1 GB (see the table in CloudHub Workers), but the value ofheap_totalisn’t 1GB. Instead,heap_totalis the maximum amount of memory that the JVM can use for heap memory, where objects are created and stored. In Java, this value changes dynamically depending on memory fragmentation, garbage collection, and other memory management features. -
Thread Count: Total number of threads used
This metric is available only for apps deployed to CloudHub or Anypoint Runtime Fabric.
API metrics:
-
Total Request Count: Sum of requests in the selected time period for the given API
Data is aggregated in one minute increments.
-
Average Response Time: Average response time of requests in the selected time period for the given API
Data is aggregated in one minute increments.
-
Response Codes: Sum of HTTP response codes that occur in the selected time period
-
Policy Violations: Sum of requests that return policy violations that you select in the alert condition.
Environments
Alerts are specific to one of your Anypoint Platform environments.
Your organization administrator creates the environments that are available to you.
Anypoint Platform supports these types of environments:
-
Design
-
Production
-
Sandbox
Email Notification Variables
Alerts deliver notifications as emails to designated recipients for each alert. Your email template can incorporate variables in the Subject and Message fields. For the description of each variable, see Variable Definitions.
| Alert Type | Metric | Applicable Variables |
|---|---|---|
CloudHub App Alerts |
CPU Utilization |
|
Memory Utilization |
||
Thread Count |
||
Message Count |
||
Message Error Count |
||
Message Response Time |
||
Anypoint Runtime Fabric App Alerts |
CPU Utilization |
|
Memory Utilization |
||
Thread Count |
||
Message Count |
||
Message Error Count |
||
Message Response Time |
||
API Alerts |
Total Request Count |
|
Average Response Time |
||
Response Codes |
||
Policy Violations |
| Variable | Definition |
|---|---|
|
URL of the triggered alert |
|
State of the alert when it was triggered. Available values are |
|
Name of the API that triggers the alert |
|
Above, above or equal, equal, below or equal, below |
|
Metric for which the alert is triggered |
|
URL that points to the built-in dashboard for the app or API that triggers the alert |
|
Name of the environment in which the resource is deployed |
|
Name of the server within the server group or cluster |
|
An operator, such as |
|
Name of the organization that owns the alert |
|
Period of time over which to measure |
|
Name of the policy whose violation triggers the alert |
|
Name of the item that triggers the alert:
|
|
Severity of the alert |
|
Name of the server, server group, or cluster |
|
Server state when the alert was triggered |
|
Count over the period of time that triggers the alert |
|
Time when the alert was triggered |
|
Value of the metric that triggers the alert |