Getting Analytics and Insights with Integration Intelligence
Use dashboards in the Salesforce ecosystem to analyze Mule app and API metrics, and get insights into related business data.
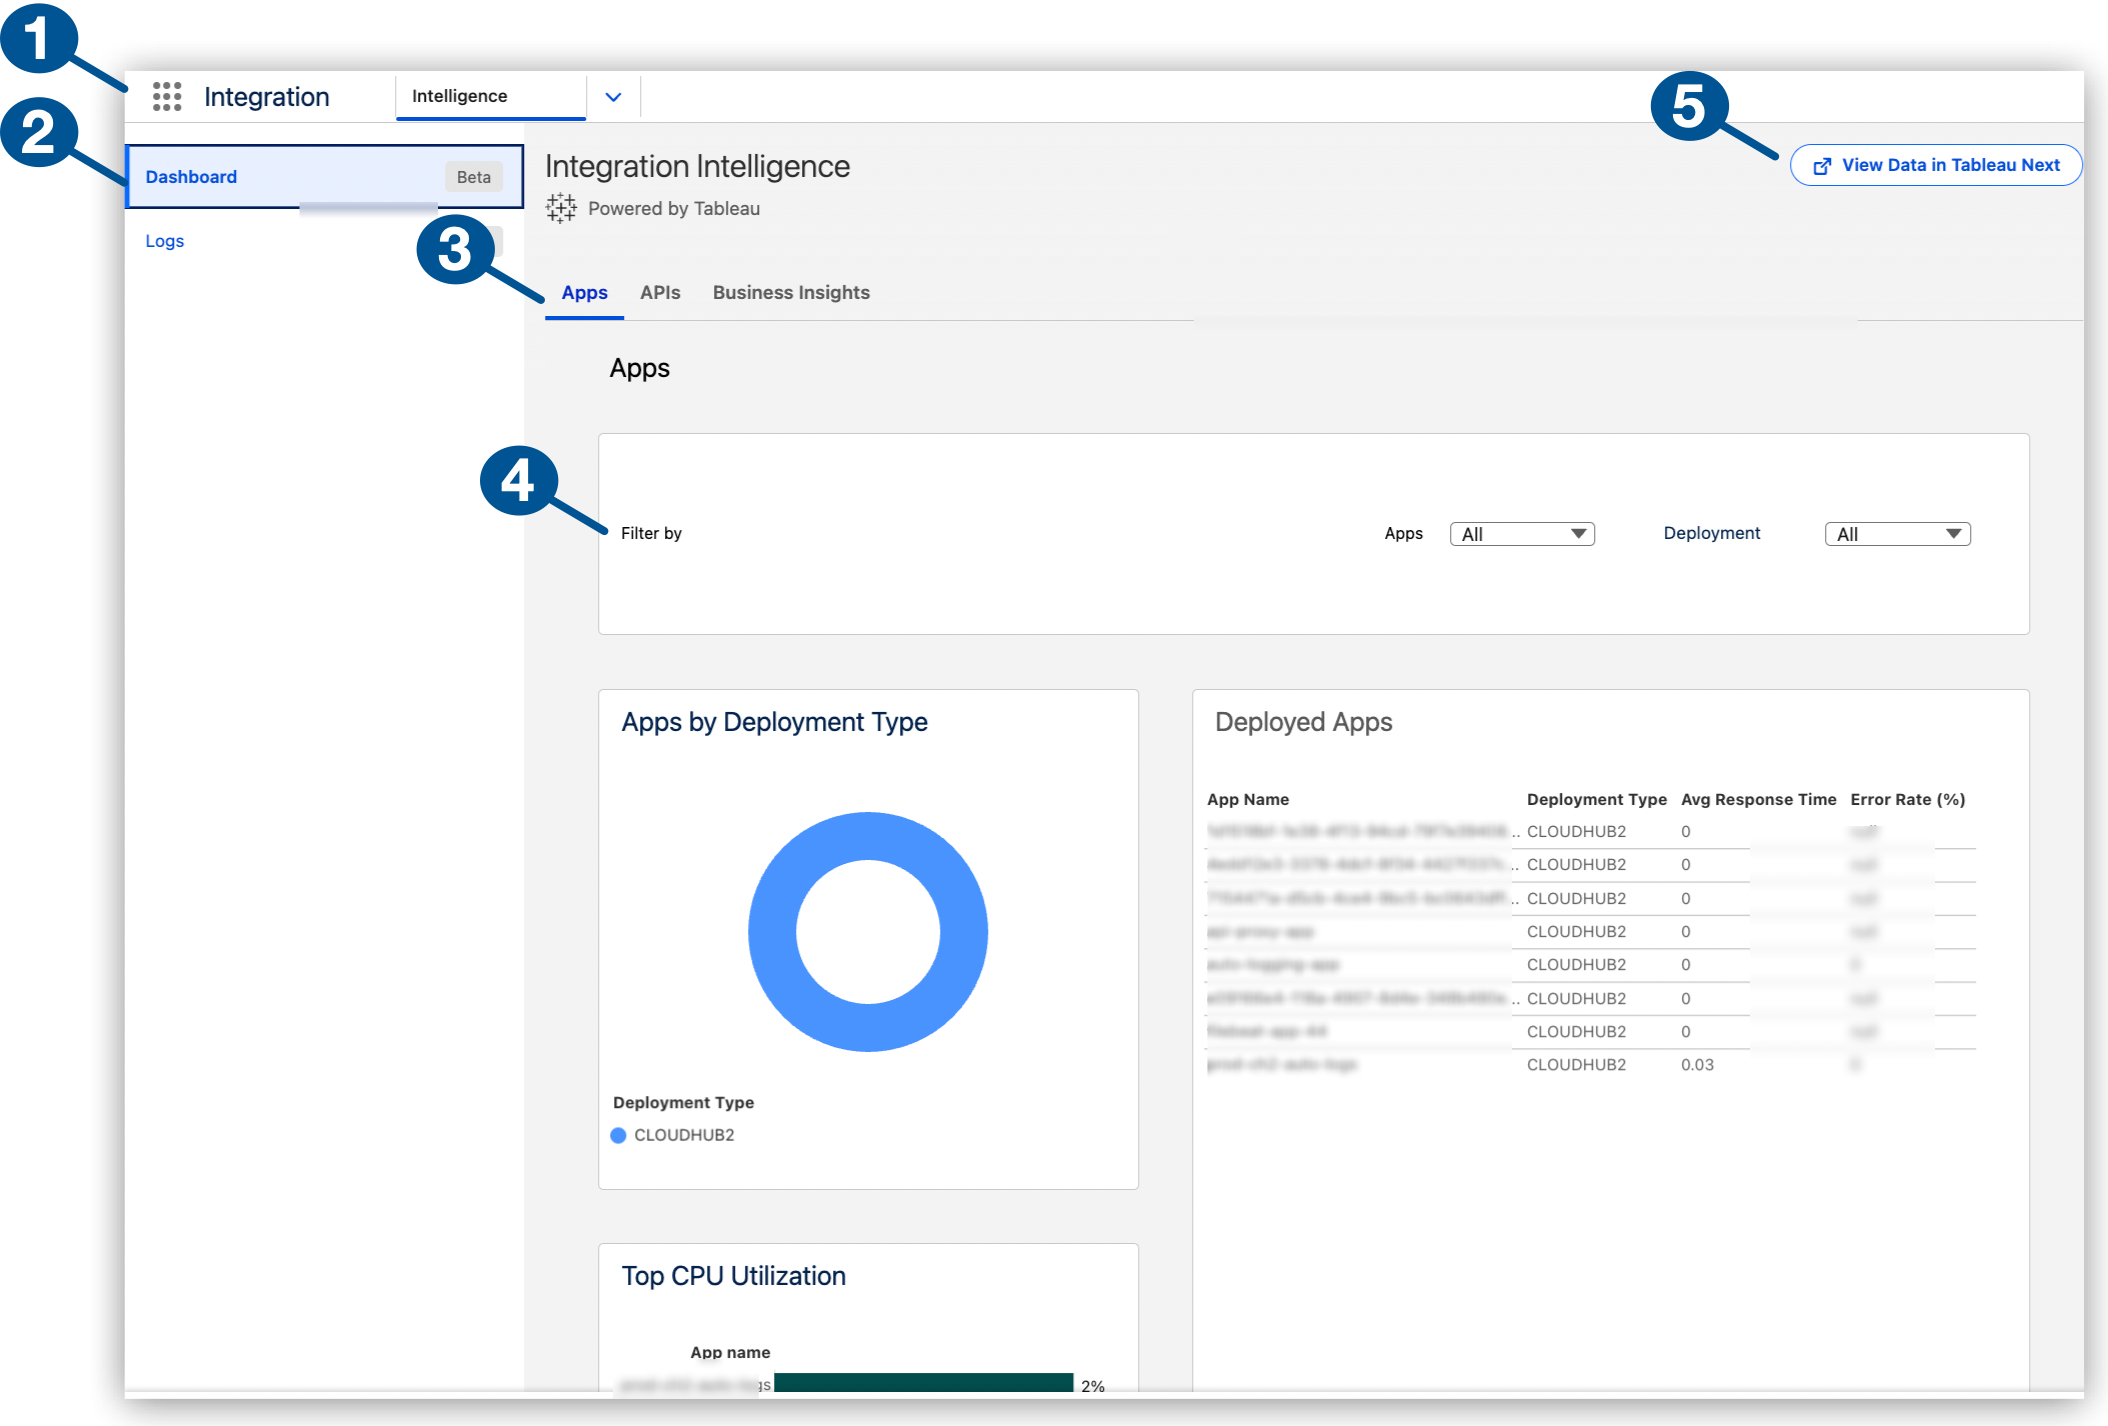
| 1 | Integration Intelligence in the Salesforce Integration app |
| 2 | Dashboard page in Integration Intelligence |
| 3 | Built-in dashboards: Apps (default), APIs, Business Insights |
| 4 | Filters for selecting a time period, apps, and deployment types, such as CloudHub 2.0, in the Apps dashboard |
| 5 | Navigation to Tableau Next for custom dashboard setup and management
This button’s label changes from Create Dashboard to Manage Dashboard after you provide a dedicated workspace in Tableau Next for custom dashboards in Integration Intelligence. |
Before You Begin
Complete the procedures in Setting Up Integration Intelligence.
Supported Deployment Types
For metrics in dashboards, Integration Intelligence supports Mule apps and Mule APIs deployed to these hosts:
-
CloudHub (CLOUDHUB)
-
CloudHub 2.0 (CLOUDHUB2)
-
Runtime Fabric (RTF)
-
Omni Gateway (FLEX)
For logs in Integration Intelligence, see Supported Deployment Types for Logs.
For information about hosts, see Runtime Plane Hosting Options.
Lookback Period
Data collection for dashboards begins after you set up Integration Intelligence.
From the Time Period filter, you can select from predefined ranges for the year (including the fiscal year), month, week, day, or quarter (including the fiscal quarter), or you can select a custom date range. The custom date range selector also indicates the available date range for your data.
Find Dashboards in Integration Intelligence
Integration Intelligence is accessible from Anypoint Platform and through the Salesforce App Launcher:
|
After initial ingestion, data can take up to 10 minutes to appear in Integration Intelligence. The first time you open Dashboards, it can take a few additional minutes for the visualizations to load. |
Navigate to Dashboards from Anypoint Platform
Navigate from Anypoint Platform to Integration Intelligence to review dashboards with metrics on your Mule apps, APIs, and business data.
-
Meet the prerequisites in Before You Begin.
-
Log in to Anypoint Platform with a user account that has permission to access Anypoint Monitoring content.
-
Navigate to Anypoint Monitoring:
Click Monitoring from the Anypoint Platform home page or from the Runtimes menu in the header.
-
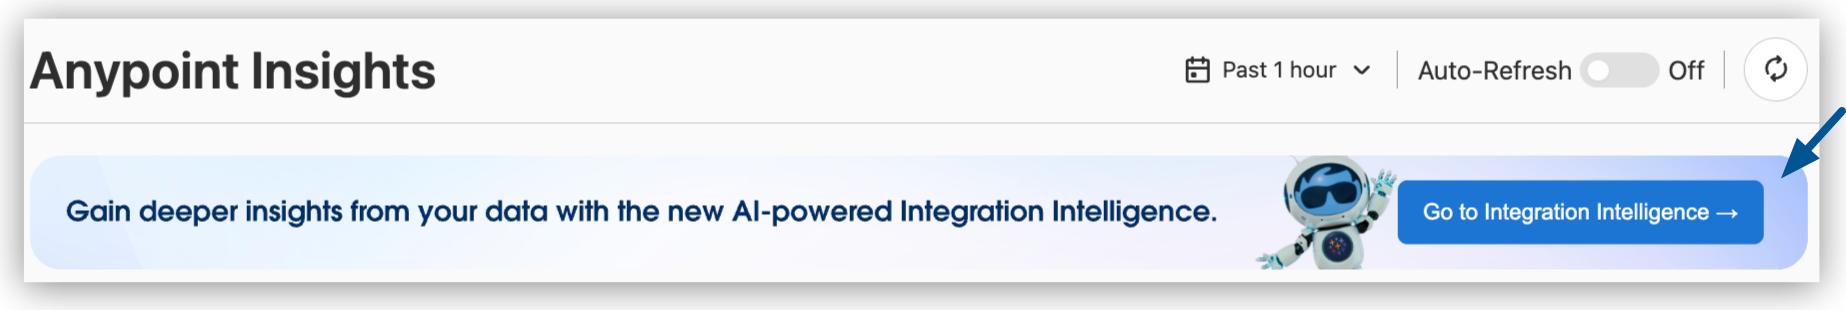
From the banner in the Anypoint Insights header, click Go to Integration Intelligence.
Integration Intelligence automatically opens to Dashboards, and Logs is accessible from the Integration Intelligence sidebar.
-
Select a tab for the dashboard you want to examine:
-
Apps (default)
-
A custom dashboard created by your team in Tableau Next
-
Navigate to Dashboards from the Salesforce App Launcher
Integration Intelligence resides in the Integration app. If you’re connected to the Salesforce org that supports your MuleSoft telemetry data, you can navigate directly to your Integration Intelligence dashboards from the App Launcher:
-
Meet the prerequisites in Before You Begin.
-
From your Salesforce environment, click
 (App Launcher).
 -
From the App Launcher, find and select the Integration app.
The launcher opens to the app’s Intelligence tab, which contains your dashboards.
-
Select a tab for the dashboard you want to examine:
-
Apps (default)
-
A custom dashboard created by your team in Tableau Next
-
Analyze Your Mule Apps in a Built-in Dashboard
Analyze Mule app metrics in Integration Intelligence:
-
Navigate to the Apps dashboard.
For guidance, see Find Dashboards in Integration Intelligence.
-
Optionally, narrow the scope of apps to review by:
-
Selecting a range of time to review from the Time Period menu.
-
Selecting one or more Mule apps from the App menu.
-
Selecting a deployment type, such as CloudHub 2.0 or Runtime Fabric, from the Deployment menu.
-
-
Get app metrics:
-
Performance Metrics: Get the total number of apps (Total Apps), number of apps with errors (Apps with Error), total number of requests to the apps (Total App Requests), and the error rate for the apps (App Error Rate).
-
Apps by Deployment Type: Hover over the data in the chart to get the number of apps by type, such as apps deployed to CloudHub 2.0.
-
Top CPU Utilization: Check performance by identifying apps that are using the most CPU resources.
-
Deployed: Check average response time, error rate, and request volume of apps over the selected lookback period.
-
Analyze Your APIs in a Built-in Dashboard
Analyze API metrics in Integration Intelligence:
-
Navigate to the API dashboard.
For guidance, see Find Dashboards in Integration Intelligence.
-
Get metrics on your APIs:
-
Performance Metrics: Get the total number of APIs (Total APIs), number of APIs with errors (APIs with Error), total number of requests to the APIs (Total API Requests), and the error rate for the APIs (API Error Rate).
-
Request Volume by Location: View the relative request volume by region, such as United States.
-
Top API Consumers by Endpoint: View relative API endpoint requests ordered by APIs with the most to least requests.
-
APIs: Get the number of clients and request volume for one or more versions of your APIs.
-
-
To get more detail, such as the number of requests, hover over the data in the charts.
Get Business Insights from a Built-in Dashboard
Get business metrics in Integration Intelligence:
-
Navigate to the Business Insights dashboard.
For guidance, see Find Dashboards in Integration Intelligence.
-
Optionally, select one or more apps to review from the App menu.
-
Get business insights for your organization:
-
Top 10 Apps by Flow Count: View apps by their relative flow counts.
-
Total Policy Violations: View the number of policy violations. For a list of policies, see Policy Availability.
-
App Usage: Flow, Message & Request Totals: Get the flow count, number of messages, and request volume for selected apps.
-
Request Volume by Endpoint (Inbound|Outbound): Get the number of inbound and outbound requests from your apps. Hovering over the apps provides the number and type of request metric (for inbound requests,
mulesoft.app.inbound.requests.sum, and for outbound,mulesoft.app.outbound.requests.sum).
-
Create Custom Dashboards in Tableau Next
Custom dashboards are useful for tailoring your analytics experience to your organization’s needs. Use Tableau Next to create custom dashboards for Integration Intelligence. Create visualizations for your dashboard to show metrics on the MuleSoft telemetry data that matters most to your organization.
Like Integration Intelligence, Tableau Next is built on the Salesforce Platform.
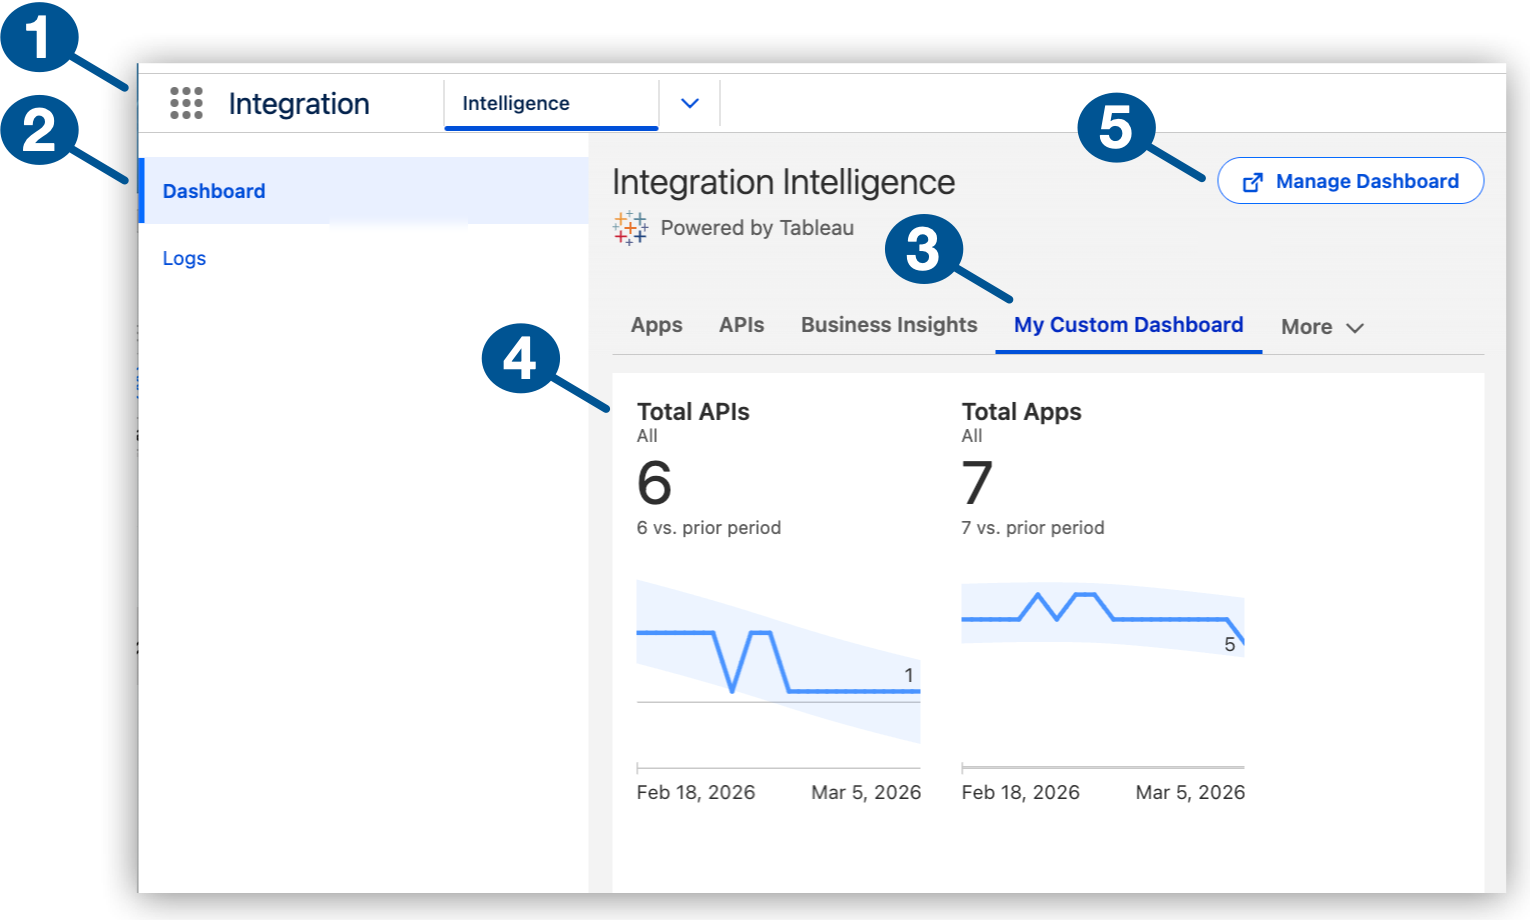
| 1 | Integration Intelligence in the Salesforce Integration app |
| 2 | Dashboard page in Integration Intelligence |
| 3 | Custom dashboard example in the My Custom Dashboard tab |
| 4 | Visualization examples
Visualizations are visual representations of your data as a chart or graph. |
| 5 | Manage Dashboard for access to custom dashboard creation and management features in Tableau Next
This button’s label changes from Create Dashboard to Manage Dashboard after you provide a dedicated workspace in Tableau Next for custom dashboards in Integration Intelligence. |
Before You Begin with Custom Dashboards
Before creating custom dashboards and visualizations for Integration Intelligence in Tableau Next:
-
Acquire one of the permission sets associated with the Tableau Next Creator license so that you can create a dedicated workspace and manage your custom dashboards. A Salesforce Administrator can assign one of these Tableau Next permission sets:
-
Tableau Unmetered Platform Analyst
-
Tableau Next Platform Analyst
-
-
Familiarize yourself with Tableau Next basics. See Learn About Tableau Next.
Learn About Tableau Next
If you’re new to Tableau Next, it’s important to understand the basics before creating a custom dashboard. Tableau Next is a composable AI analytics platform for turning your data into actionable insights. Use Tableau Next to review, create, and manage your organization’s assets (workspaces, data, semantic models, dashboards, and visualizations).
Tableau Next provides in-app resources for learning to work with assets from your organization’s home page. To locate these resources:
-
Navigate to Integration Intelligence dashboards.
See Find Dashboards in Integration Intelligence for guidance.
-
From Integration Intelligence, click the
(App Launcher), and then search for and click Tableau Next.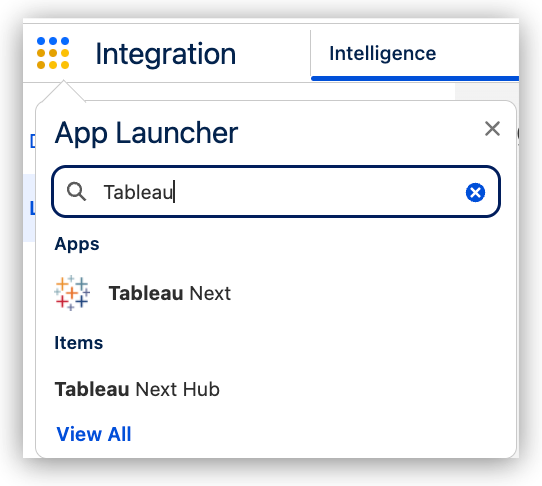
For more information, see Tableau Next Home and Workspaces.
-
Get an introduction to Tableau Next features from the Getting Started video and other items under Recommended for You in your organization’s home page.
-
Review your organization’s assets:
-
Any existing workspaces for collecting and managing analytic assets, launching data analysis, and collaborating with your team
You’ll require a workspace named Integration Intelligence - Custom Dashboards for custom dashboards in Integration Intelligence.
-
Data, including telemetry data from your Mule apps and APIs, hosted in Data 360 as data lake objects
-
Semantic models that map data to standardized terms and logic for useful insights
You’ll use the MuleSoft Observability Semantic Model when creating visualizations for your workspace.
-
Visualizations that you can add to your own dashboards
Visualizations are visual representations of your data as a chart or graph.
-
For more information, see Tableau Next on the Salesforce Help site.
After familiarizing yourself with Tableau Next, you can proceed to Configure a Workspace for Your Custom Dashboards.
Configure a Workspace for Your Custom Dashboards
Before creating your first custom dashboard for Integration Intelligence, create a workspace named Integration Intelligence - Custom Dashboards and connect to MuleSoft Observability Semantic Model. This model incorporates Anypoint Monitoring metrics to capture insights on your app and API telemetry data.
-
Meet the prerequisites in Before You Begin with Custom Dashboards.
-
From Integration Intelligence, click Create Dashboard.
If Manage Dashboards appears instead of Create Dashboard, your workspace is already set up.
-
Add a blank workspace named Integration Intelligence - Custom Dashboards.
This required name dedicates the workspace to Integration Intelligence for all custom Integration Intelligence dashboards that you create.
For guidance, See Create a Workspace in Tableau Next.
-
Add the required semantic model to your workspace:
-
Click Add and select Semantic Model to open Add Semantic Model.
-
Under Add Existing, click Semantic Model.
-
Select and Add the model named MuleSoft Observability Semantic Model.
+ This model connects to the Integration Intelligence data and metrics required for visualizations (such as charts) that you add to your dashboard. You’re now ready to create a custom dashboard for Integration Intelligence. For guidance see Configure a Custom Dashboard in Tableau Next.
-
Configure a Custom Dashboard in Tableau Next
Use Tableau Next to configure a custom dashboard with visualizations for Integration Intelligence. You can create one or more dashboards to suit your organization’s needs, and each dashboard can contain multiple visualizations.
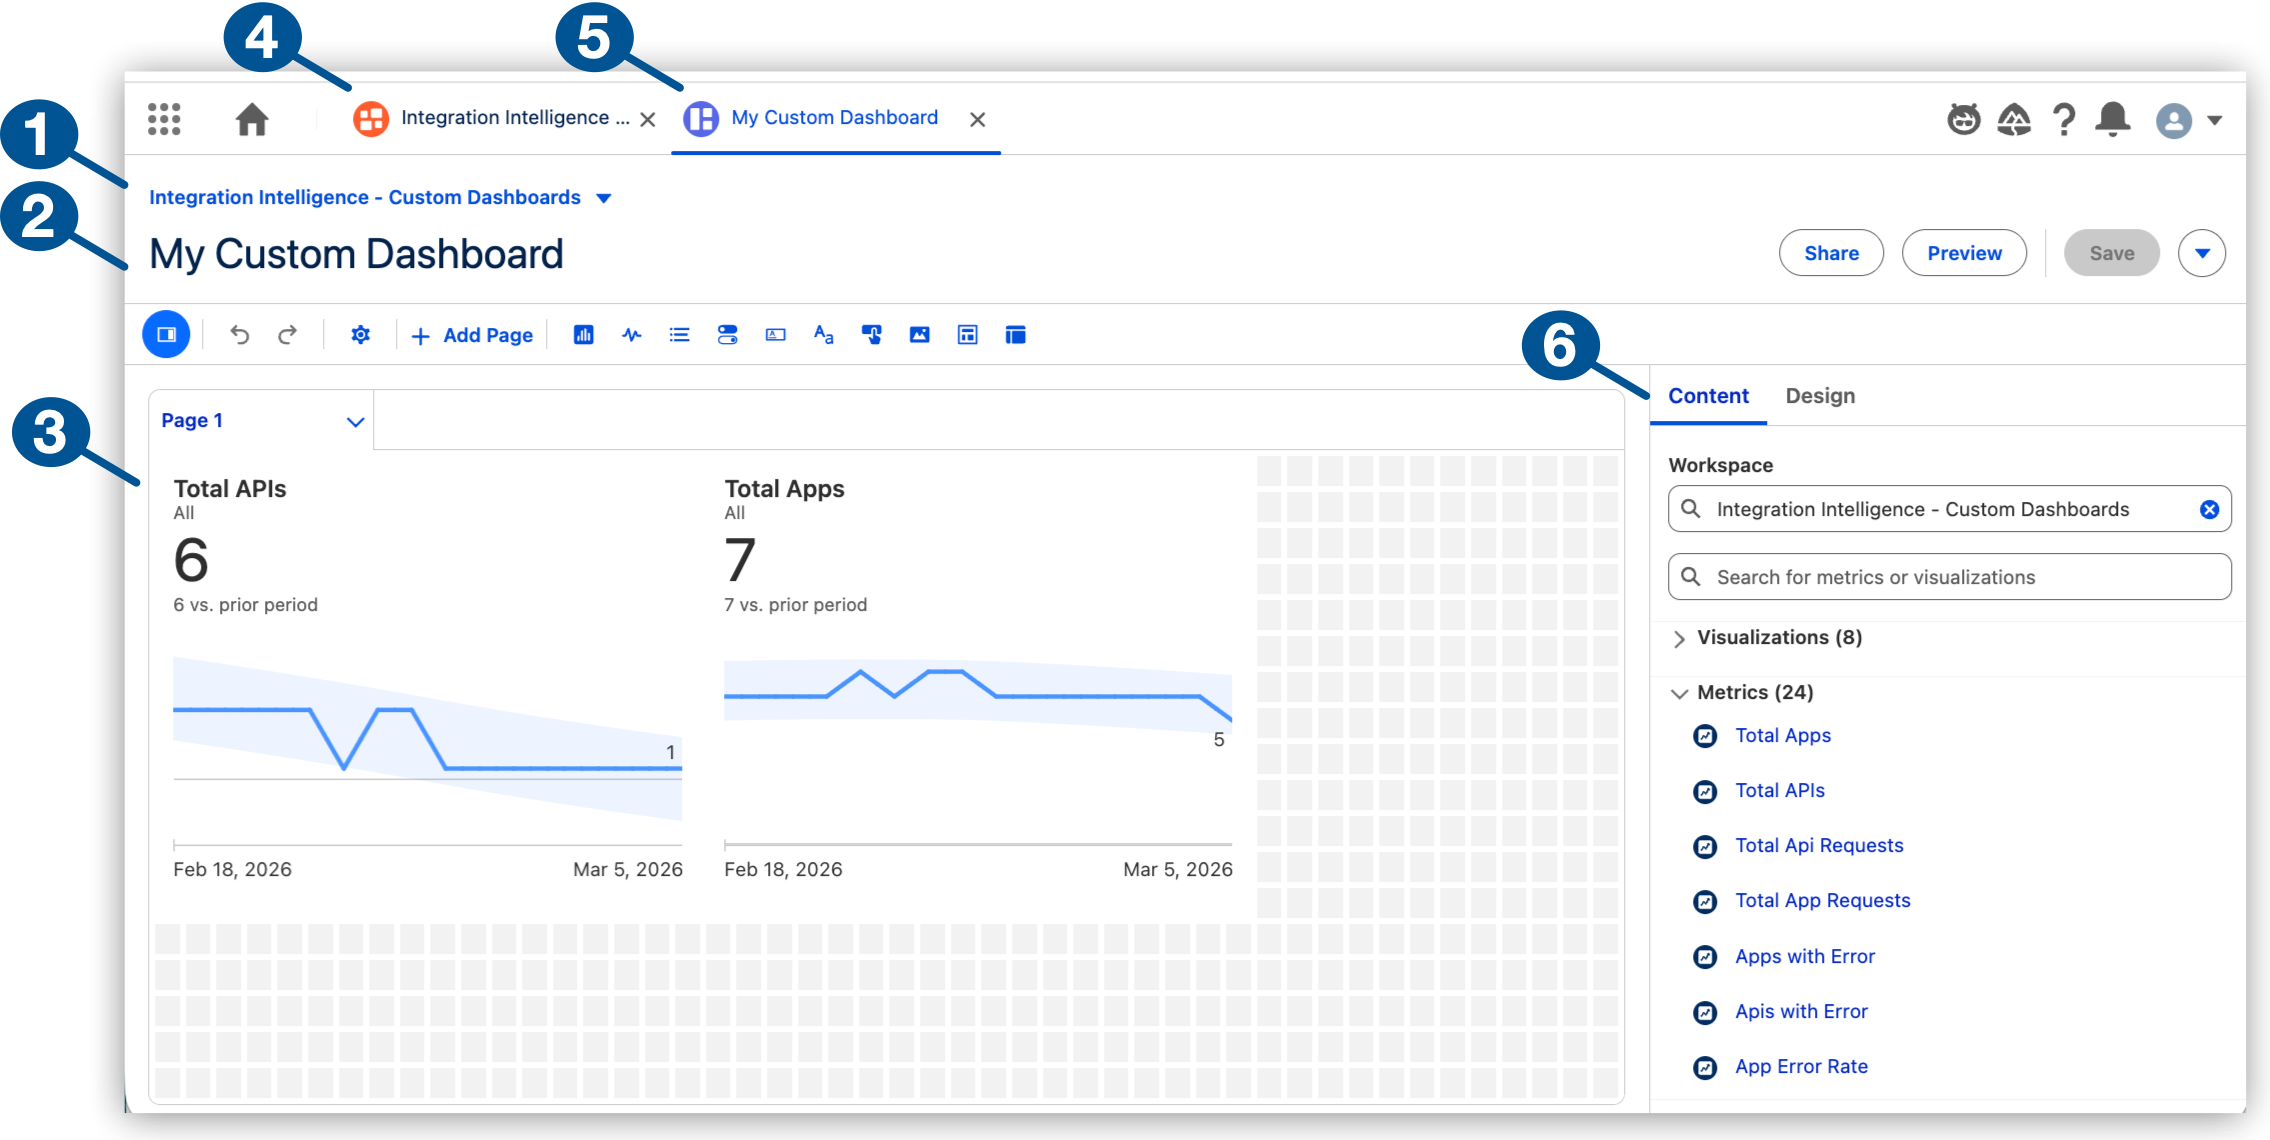
| 1 | A custom dashboard configuration page in Tableau Next
Notice that the dashboard is in the Integration Intelligence - Custom Dashboards workspace so that it can appear in Integration Intelligence. |
| 2 | A custom dashboard configuration named My Custom Dashboard |
| 3 | Visualizations in the custom dashboard
Visualizations are visual representations of your data as a chart or graph. |
| 4 | Tab for Integration Intelligence workspace (Integration Intelligence - Custom Dashboards) in Tableau Next |
| 5 | Tab for a custom dashboard configuration page |
| 6 | Content options for visualizations and metrics, and design options for the workspace (such as grid, theme, and background image)
For more information, see Create Effective Dashboards With Tableau Next. |
Create a custom dashboard:
-
Meet the prerequisites in Before You Begin with Custom Dashboards.
-
From Integration Intelligence, click Manage Dashboards to open your workspace for your custom Integration Intelligence dashboards and related assets.
If Create Dashboard is present instead of Manage Dashboard, set up a dedicated workspace in Tableau Next before creating a dashboard.
For more guidance, see the Tableau Next documentation Create a Workspace in Tableau Next.
-
Add the asset MuleSoft Observability Semantic Model to your custom dashboard:
From the Add menu, select Existing Asset, and then add the existing MuleSoft model to the workspace.
For more guidance, see Create or Add an Asset in a Workspace.
-
Create a custom dashboard with visualizations.
For guidance, see Create Visualizations and Dashboards in Tableau Next.
-
After creating your custom dashboard and visualization, view the dashboard in Integration Intelligence by clicking the tab for your custom dashboard.
For help opening Integration Intelligence, see Find Dashboards in Integration Intelligence.
Copy, Download, or Explore Metrics
Copy or download an image of any chart or table in a dashboard, or open a page dedicated to specific metrics.
-
In a chart or table in a dashboard, click an empty area, and then hover to display a
 (menu arrow).
 -
Click
(menu arrow). -
Select an option:
-
Copy Image: Copies a screenshot of the chart or table to your clipboard.
-
Download Image: Downloads a screenshot of the chart or table to your local drive.
-
Explore: Opens a new tab that contains the selected chart or table on a full page. You can also add the chart to an existing dashboard or create a dashboard for the chart from this page.
-