Examining Traces
On US and EU Cloud instances of Anypoint Platform, use Traces to track the flow of requests that travel through service pipelines. Get data from the Open Telemetry (OTEL) spans that form your traces. Troubleshoot requests with errors or slow response times, optimize your resource allocation, and track calls end-to-end. Monitor the performance of a specific transaction as it travels through services.
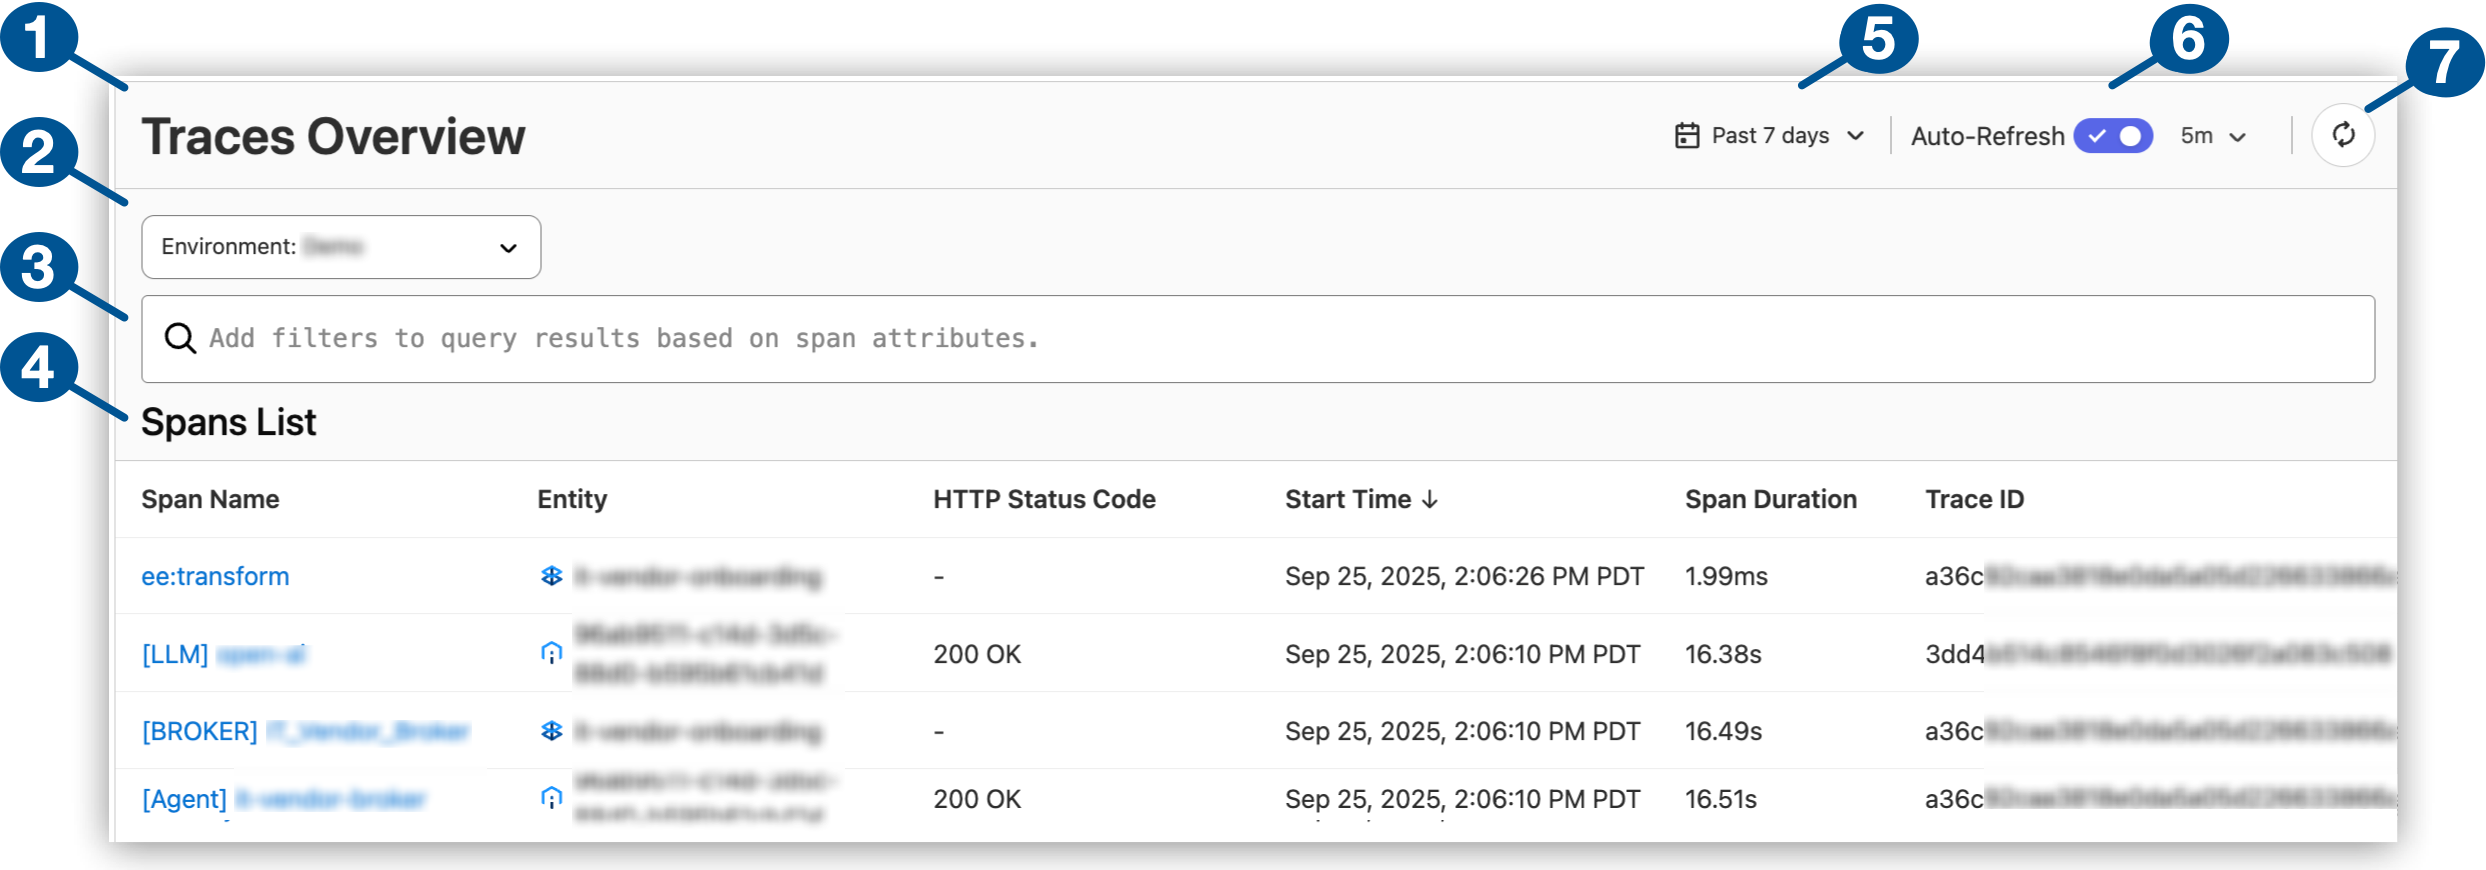
| 1 | Traces in Anypoint Monitoring |
| 2 | Environment selector for your deployments (such as Sandbox or Production) |
| 3 | Filter field for queries that narrow the list of logs to return |
| 4 | List of spans for the supported agents, brokers, MCP servers, and Mule apps |
| 5 | Lookback selector for the period of time to capture in the Span List (from the default of 15 minutes to the last seven days) |
| 6 | Auto-Refresh every 5, 15, or 30 minutes, every hour, or one time per day |
| 7 | Manual refresh button |
In addition to reviewing traces in Anypoint Monitoring, you can use Telemetry Exporter to export traces to third-party observability and analytics platforms.
Traces Availability
Traces are available for specific:
Supported Traces
Traces include spans for:
-
Agentic assets: Agents, brokers, and MCP servers
-
Flows: Mule flows for the selected task of the specific service
-
Events: Mule runtime events or user actions for the selected service
Before You Begin
For all types of traces, these prerequisites apply:
-
The Anypoint Integration Advanced package or a Titanium subscription to Anypoint Platform
-
Permission to view Mule apps, APIs, and agentic assets (agent, broker, and MCP server instances) in Anypoint Monitoring
For Mule app and API tracing, these prerequisites apply:
-
For apps deployed to CloudHub 2.0:
-
For Runtime Fabric, enabled trace data collection on apps deployed to Runtime Fabric
-
Mule runtime version 4.6 or later
-
HTTP Connector version 1.8 or later
Get Traces from Traces Overview
View a list of spans from across entities (agents, brokers, MCP servers, and Mule apps) in Traces Overview in Anypoint Monitoring. Get high-level details on each root span in a trace. Use filters to narrow the scope of spans in the Spans List. Get additional detail on each span in the hierarchy of spans that form a trace (from root span to its descendants).
-
Log in to Anypoint Platform with a user account that has permission to access Anypoint Monitoring content.
-
Navigate to Anypoint Monitoring:
Click Monitoring from the Anypoint Platform home page or from the Runtimes menu in the header.
-
In the sidebar, click Traces.
-
Make sure you’re using the business group that contains the spans.
-
Select up to the last seven days of spans (see item 5).
15 minutes is the default.
-
Select the environment that contains your spans.
-
Optionally, provide a filter query to narrow the search results.
Find Traces for Agent Visualizer Nodes
Agent Visualizer links to traces for agentic assets (agent, broker, and MCP server instances).
-
In Agent Visualizer, click a node to open its detail card.
-
Click View Traces to navigate to the traces for the node in Trace Details (in Anypoint Monitoring).
For more information about nodes in Agent Visualizer, see Agent Visualizer Overview.
Get Trace Details
After navigating to Trace Details from Traces Overview in Anypoint Monitoring or from a node in Agent Visualizer, get information about the trace and its spans.
-
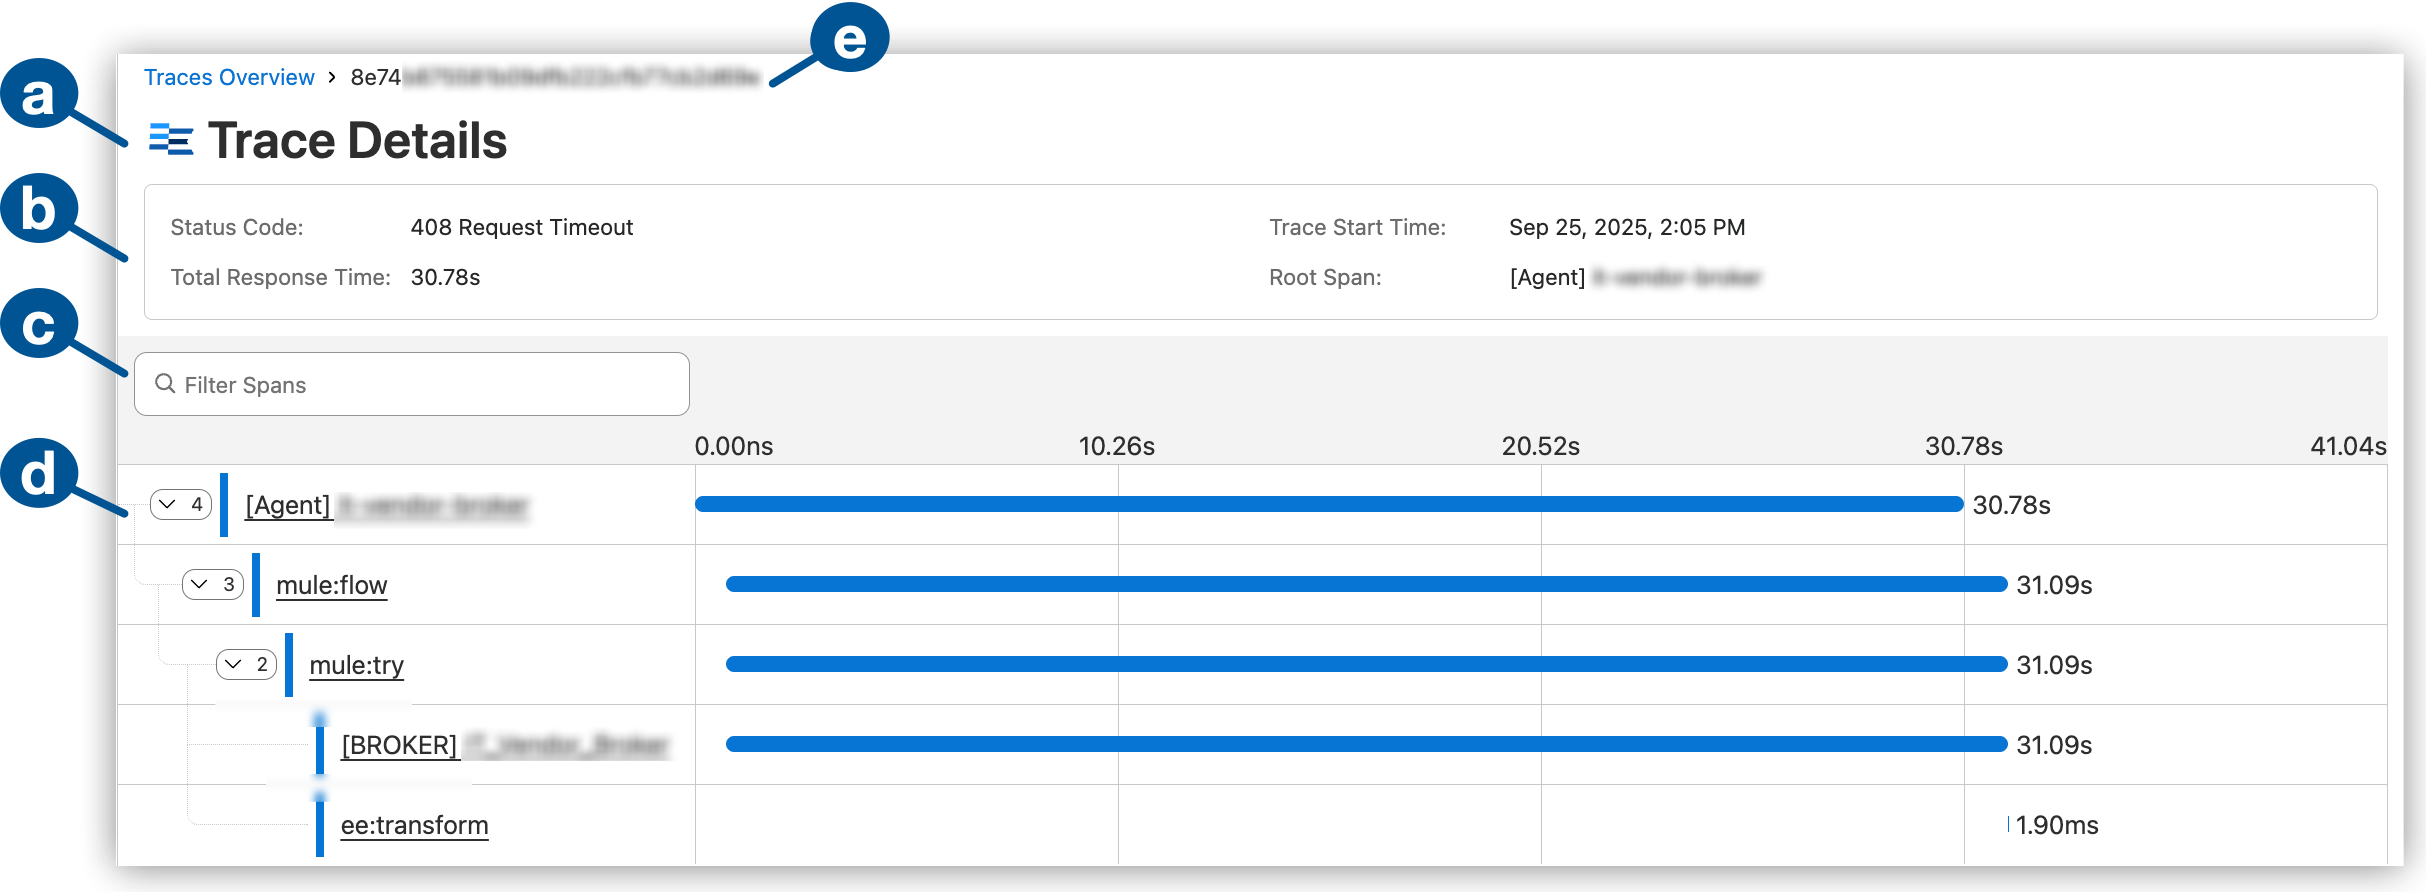
Review information about the trace:
Trace Details displays the selected instance’s traces in a span tree, starting from the root span for the instance.
-
Trace Details page for a span selected from Trace Overview or through a node in Agent Visualizer
-
High-level data about the selected span:
-
Status Code: HTTP response status of the trace (for example,
0 No Response,200 OK,500 Internal Server Error) -
Span Start Time: The time the trace started, in UTC
-
Total Response Time: The time taken for the trace to execute
-
Root Span: The request or operation that initiated the trace
-
-
Search for spans by full or partial matches to the span name
The page displays matching spans.
-
Trace hierarchy of spans, starting from the root span through its descendants
-
Trace ID of the root span
-
-
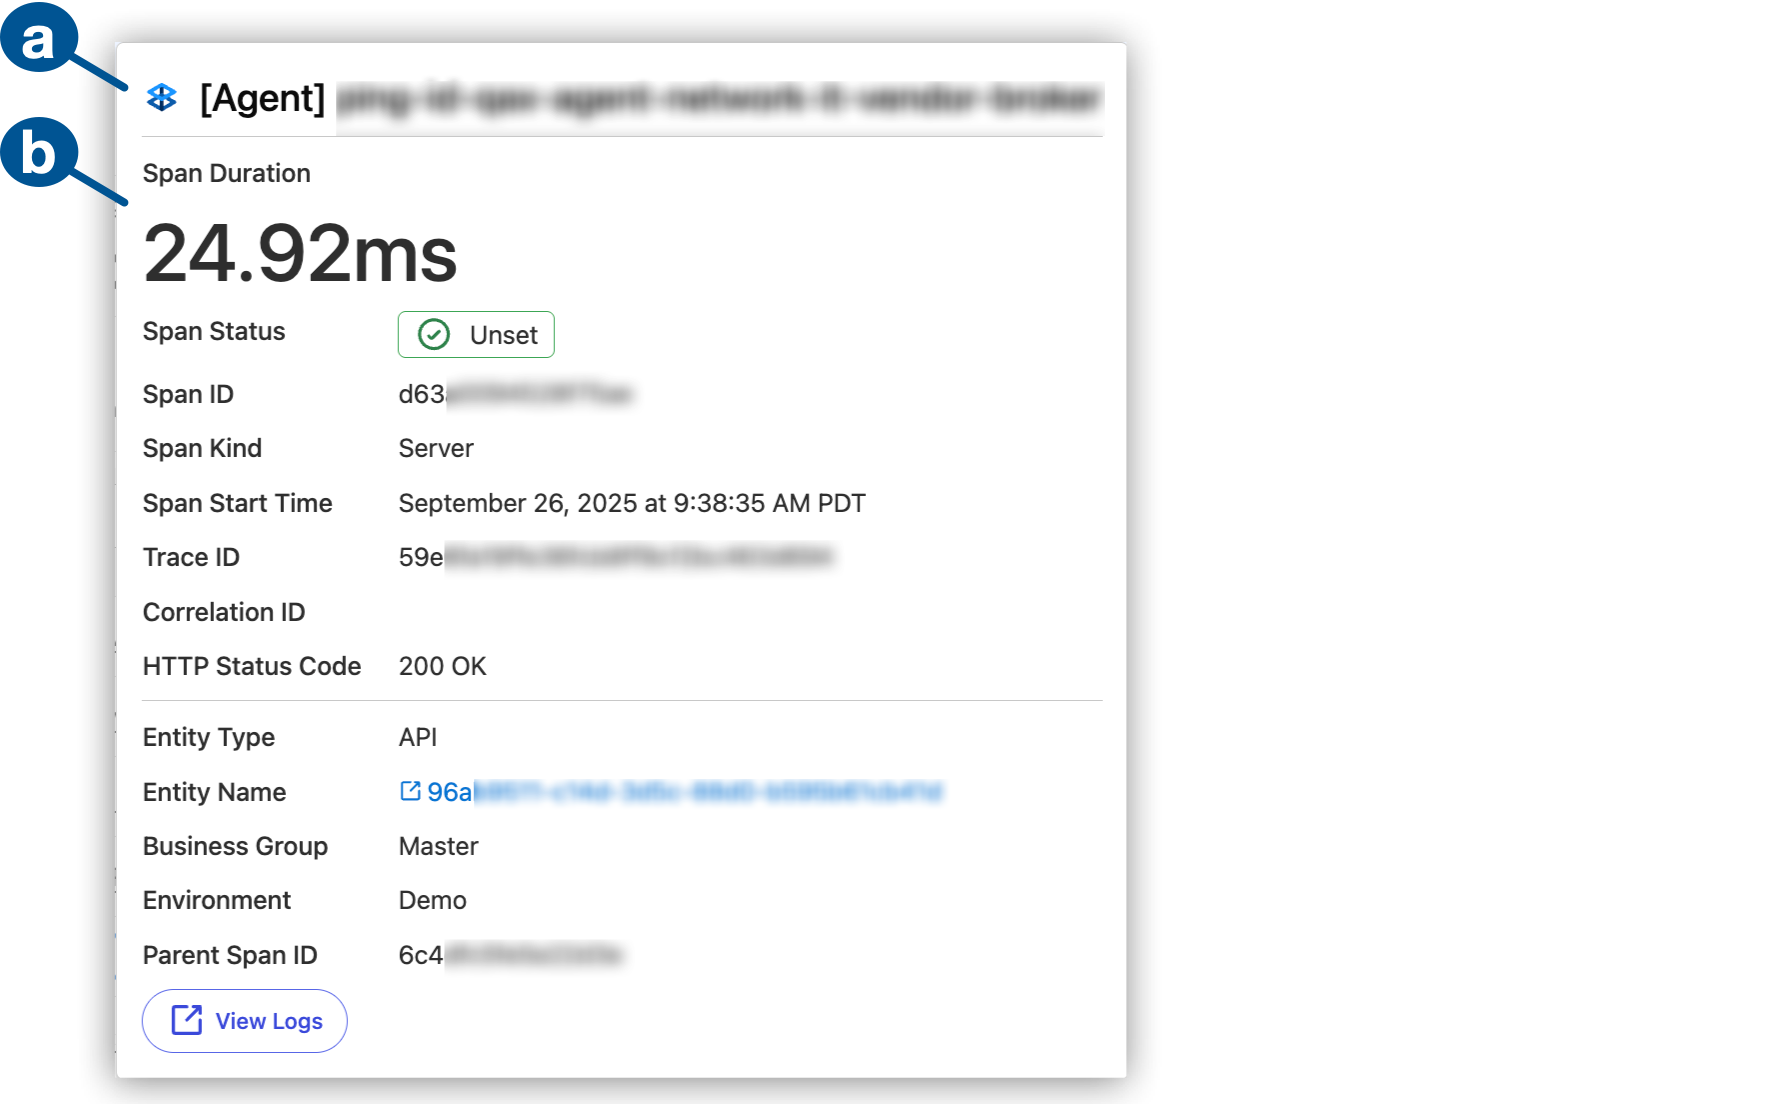
To get more information about a span in the details page, click the span:
-
Span Name: Name of the span.
-
Filter Spans
To narrow the list of spans in Traces Overview, provide a filter query in the search field.
-
Place your cursor within the search field and click to display a list of filters.
-
Select a filter from the field’s dropdown.
Filter Operators Description api_instance_id=Version of an API instance that’s associated with a span. You can find the instance’s ID in API Manager.
correlation_id=Correlation ID associated with a span (see Correlation ID).
entity_name=,INName of entities associated with spans.
http_status_code=,INHTTP status codes associated with span.
span_id=ID of a span contained in traces.
span_name=,INName of a span.
trace_id=,INID associated with a span.
-
Select an operator for the filter:
-
=accepts a single alphanumeric value. -
INaccepts one or more comma-separated, alphanumeric values. The values get processed as logical ORs.
-
-
Select a value from the search field’s Top Value list. If the value you’re looking for isn’t in the list, start typing a partial match to your value, and then select the value.
Tip: If you’re providing search values to the
INoperator (such asentity_name IN ['value1', 'value2']), manually adding a comma after a value before selecting another value from the Top Value list can help with valid query formation.Example:
This example gets spans named
my-spanthat have status code '404', '502', or '200':http_status_code IN [ '404', '502', '200' ] span_name = my-span
To edit or delete a filter, click the filter, and then click Edit Filter or Delete Filter from the Actions list for the filter. To avoid issues when editing, you can delete the filter and then add it back with the values you want.
Tips:
-
If no traces appear after applying a query, change your filters, the lookback setting, or business group.
-
Selecting multiple filters of the same type isn’t allowed.
-
Filters get processed as logical ANDs. If a span doesn’t match one of the filters, the query won’t return spans.
Span Details
Traces provide information about a root span and its descendants in dedicated Trace Details pages. Each span listed on the page links to details about that span:
-
Span Duration: Time the span took to execute
-
Span Status: Status of the span (OK, ERROR, Unset)
-
Span ID: ID of the span
-
Span Kind: Source of the span operation or request (Server, Internal, Client)
-
Span Start Time: Time that the span started, in UTC
-
Trace ID: ID of the trace in which the span occurred
-
Correlation ID: Unique identifier that’s generated before sending an event to the next processor in the Mule flow (see Correlation ID)
-
HTTP Status Code: HTTP status code of a span that is a request. Statuses include 0 No Response, 200 OK, and 500 Internal Server Error.
-
Entity Type: Type of entity associated with the trace. Types include App, API.
-
Entity Name: Name of the entity associated with the trace
-
Business Group that the span belongs to
-
Environment that the span belongs to
-
Parent Span ID: ID of a span that contains the selected span
Parent spans don’t have a value in this field. Use the Trace ID to track this span.
-
View Logs: Find the root span in Anypoint Monitoring logs.
Environments
Select the environment containing the spans you want to review in Traces Overview.
Your organization administrator creates the environments that are available to you.
Anypoint Platform supports these types of environments:
-
Design
-
Production
-
Sandbox
Business Groups
If you work from the root organization level, you can query all spans across the entire organization. If you’re working from a business group that’s a descendant of the root, the query returns spans from that business group only.
To view or select a different business group, use the business group dropdown.
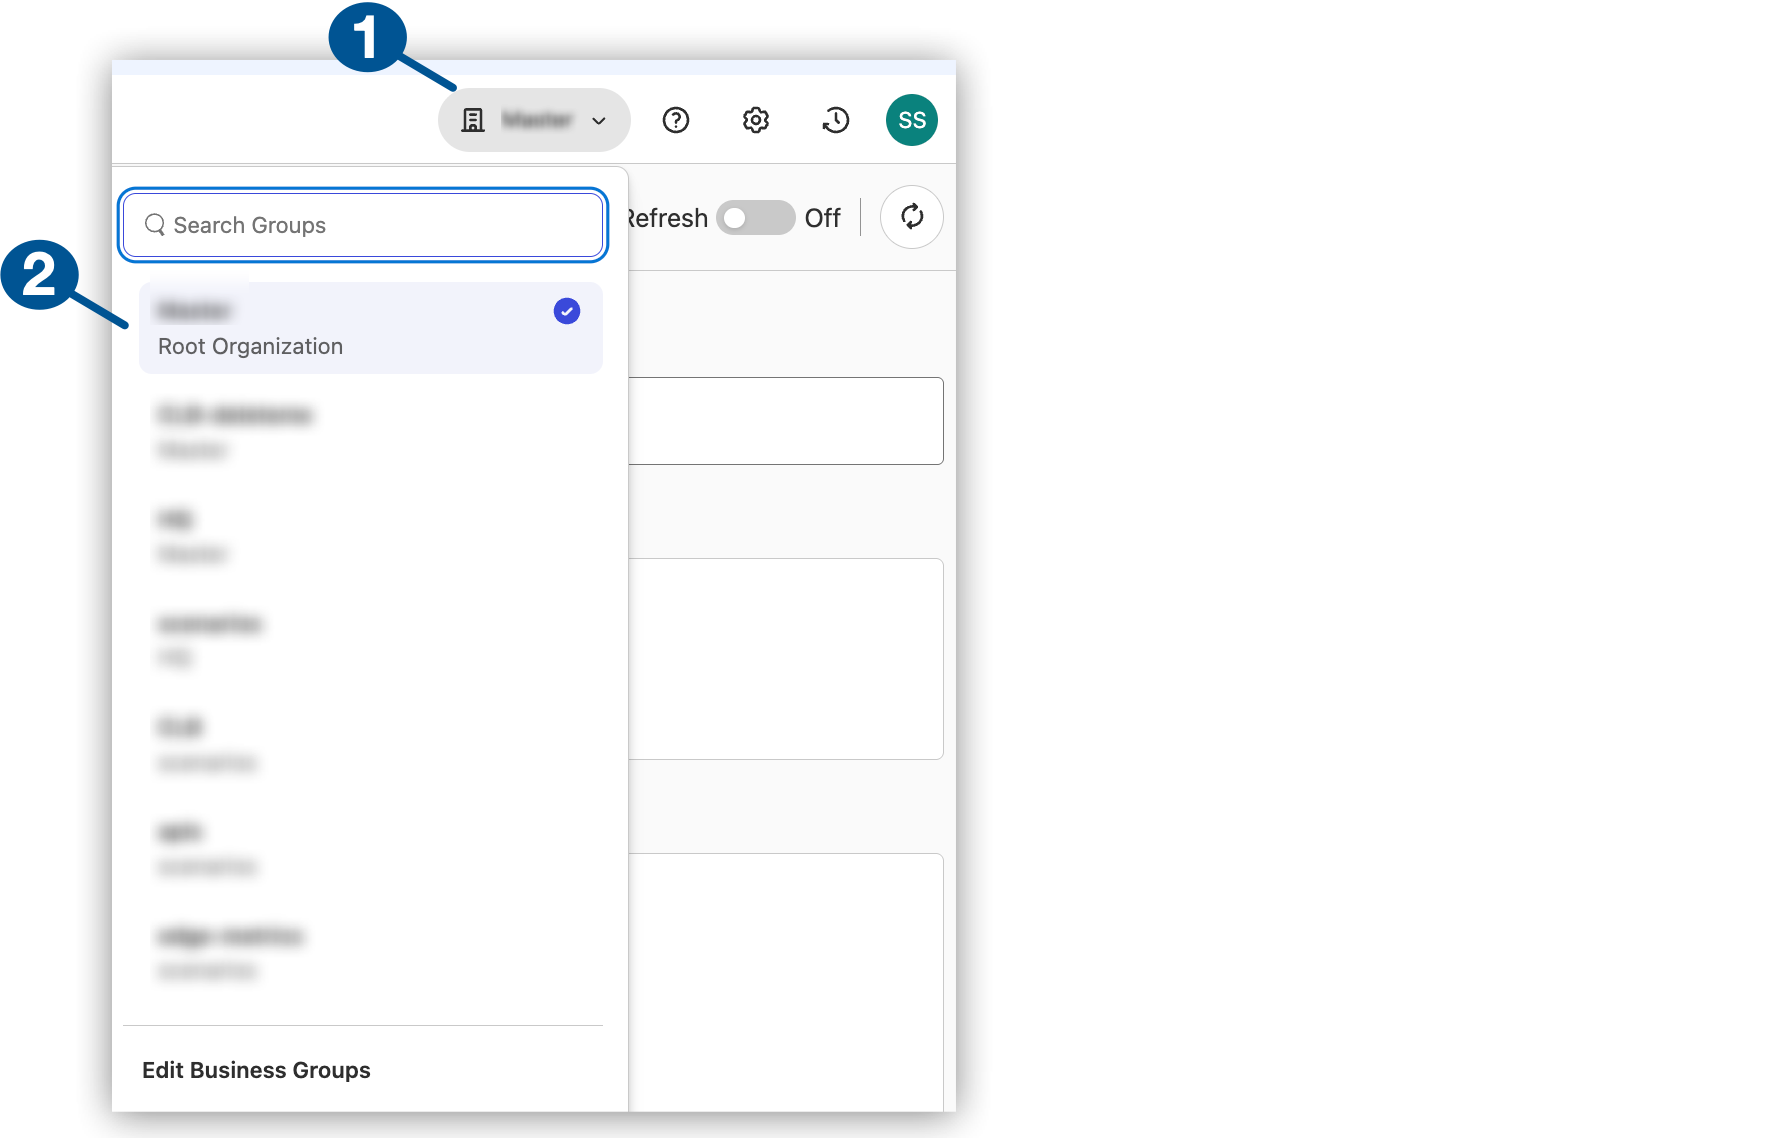
| 1 | Business group that contains spans in the Span List |
| 2 | Selectable business groups
In the example, the root organization is active. |
See Also
-
Enable Trace Data Collection (Shared Space)
-
Enable Trace Data Collection (Private Space)