
Debug the American Flights API
After implementing your API flows, validate that the application behaves as expected before writing automated tests. In this section, you run the project locally and use the debugger to trace request execution and error routing.
Run the Application Locally
Before testing your API, start the Mule application locally to verify the implementation works as designed.
-
Open the
american-flights-api-mainflow. -
Click the Listener element.
-
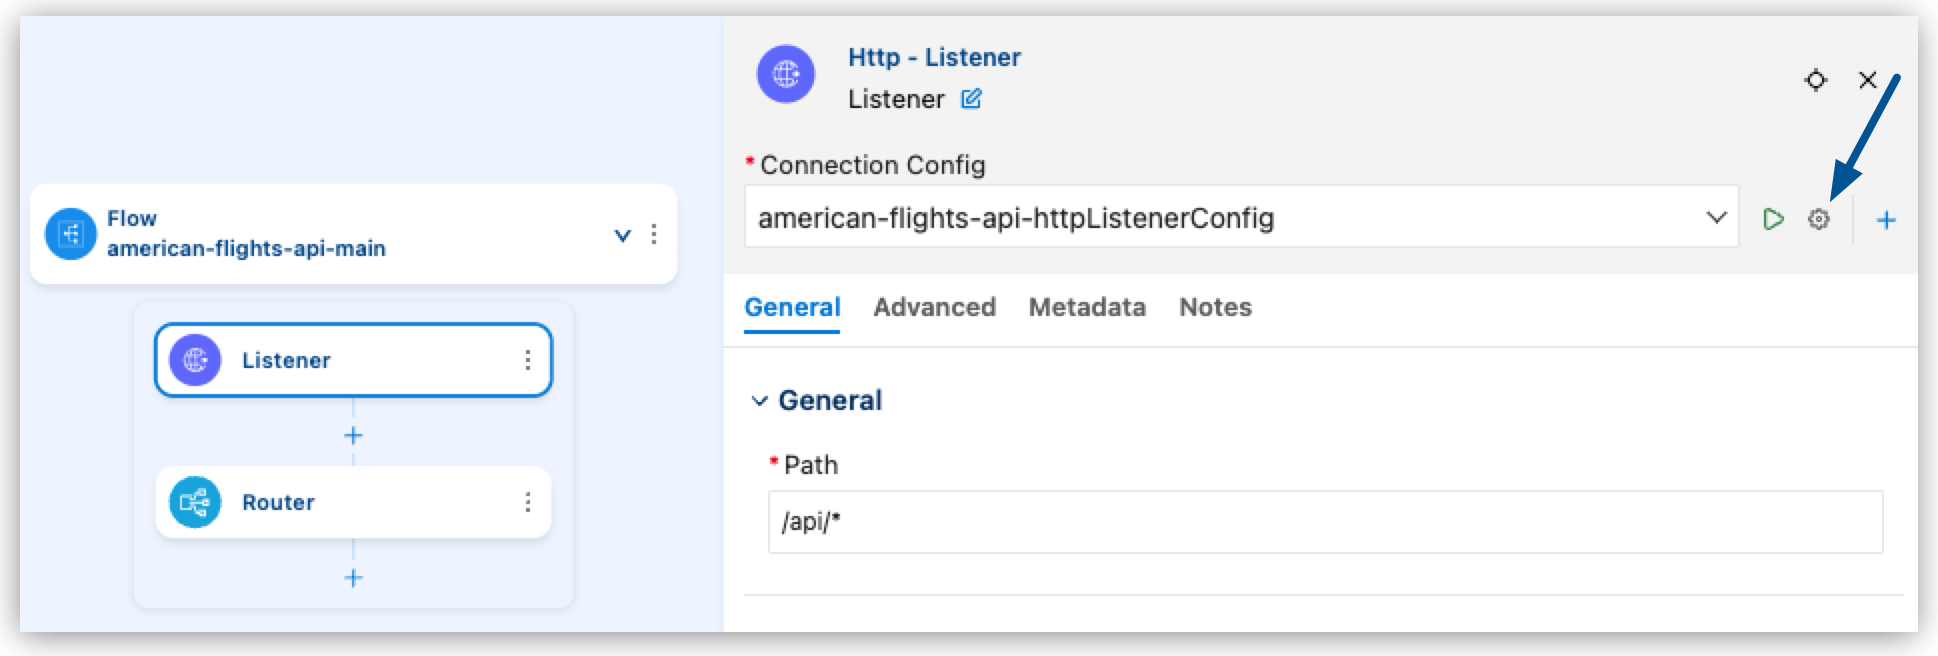
On the Connection Config field, click Edit Connection (
 ).
).
-
Verify the values and update them if necessary:
Field Name Field Value Host
0.0.0.0Port
8081 -
Open the Run and Debug panel.
Show me how
-
Click the
 (Run and Debug) icon in the activity bar.
 -
Use the keyboard shortcuts:
-
Mac: Cmd+Shift+d
-
Windows: Ctrl+Shift+d
-
-
Select View > Run.
-
-
In the top menu, ensure Run Mule Application is selected and click Start Debugging (
 ).
). -
Wait for the application to deploy. You see deployment messages in the Output panel.
When deployment is complete, you see a message similar to:
********************************************************************** * - - + APPLICATION + - - * - - + STATUS + - - * ********************************************************************** * american-flights-api-implementation-1.0.0 * DEPLOYED * ********************************************************************** -
In your REST client (such as Advanced REST Client), test your API endpoints:
-
Send
GET http://localhost:8081/api/flightsand verify a200response with flight data. -
Send
GET http://localhost:8081/api/flights/AA123and verify a200response with data for flight with"ID": 1. -
Send
GET http://localhost:8081/api/flights/123and verify a400response from your API specification’s path parameter validation.
-
-
In Anypoint Code Builder, click Stop (
 ) in the debug bar.
== Understand the Debugger
) in the debug bar.
== Understand the Debugger
The built-in debugger in Anypoint Code Builder helps you understand how your Mule application processes requests, inspect variable values at runtime, and trace error-handling paths.
Breakpoints pause execution at specific components in your flow, so you can inspect the current state of the message payload, attributes, and variables. There are two types of breakpoints:
-
Component Breakpoint: Pauses execution before a specific component executes (such as a Transform Message or Database Select operation).
-
Error Breakpoint: Pauses execution when an error occurs, allowing you to inspect the error object.
When the application running in debug mode reaches a component with a breakpoint, execution pauses and the IDE highlights the current component with a yellow border.
The Debug panel opens automatically, showing the current values of Mule variables, message attributes, payload, and the flow execution path leading to the current breakpoint.
Set Component Breakpoints
Set breakpoints in your application to pause execution and evaluate values at runtime.
-
With your application stopped, open the
get:\flights\(flightId):american-flights-api-configflow. -
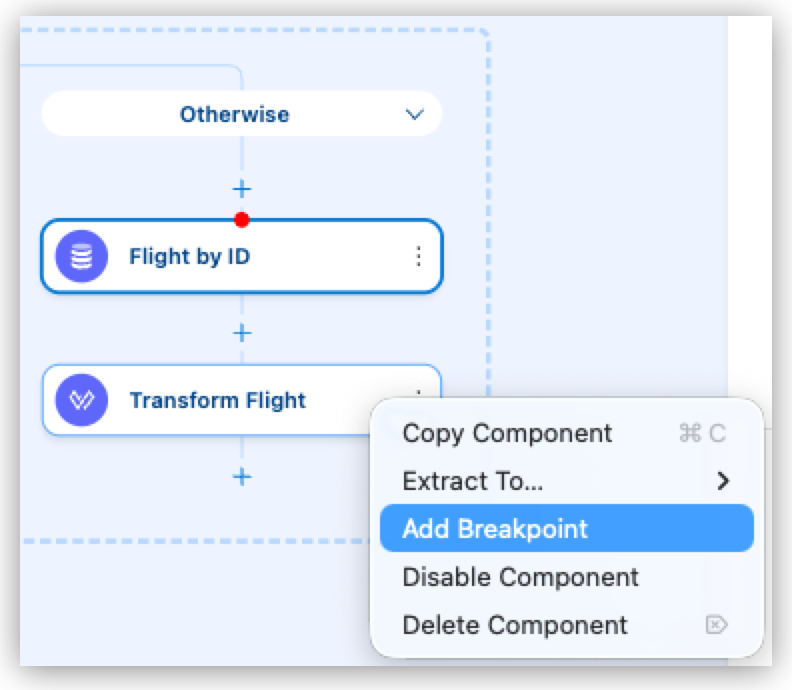
Right-click the Flight by ID Database Select operation.
-
Select Add Breakpoint from the context menu.
A red dot appears on the component, indicating an active breakpoint.
-
Add a breakpoint on the Transform Flight component after the database query to inspect the payload.
Start a Debug Session
-
Click the Run and Debug icon in the activity bar.
-
Ensure Debug Mule Application is selected in the dropdown.
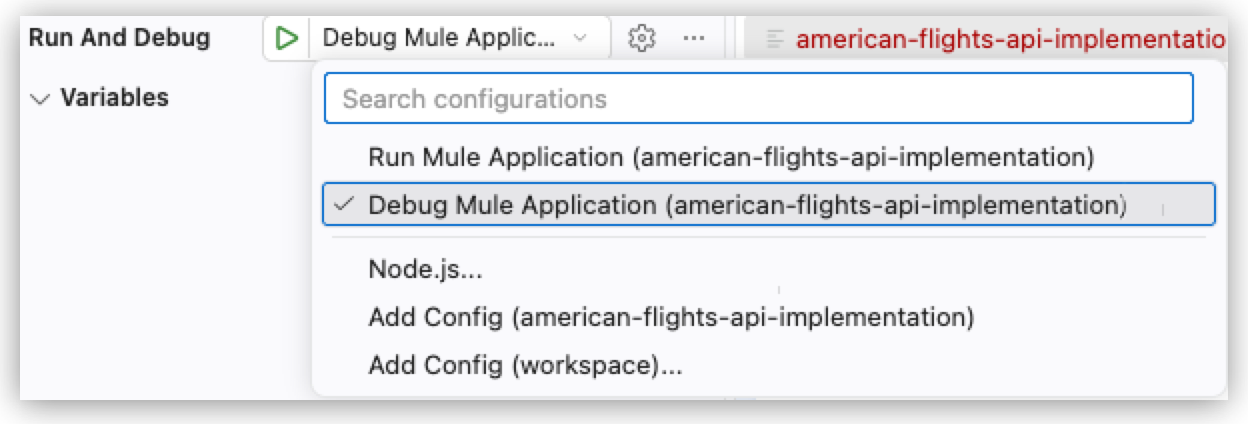
-
Click the Start Debugging button (green play icon).
-
Wait for the application to deploy in debug mode.
Step Through the Execution and Inspect Variables and Payload
-
After your application starts running in debug mode, send a GET request from your REST client to your local application:
http://localhost:8081/api/flights/AA123The execution pauses at the Flight by ID breakpoint.
-
In the Variables section of the Debug panel, expand Mule Message > Payload.
At this point, the message is empty because the query to the database hasn’t executed.
-
Expand Mule Message > Attributes to see HTTP request information:
-
uriParams.flightId: The flight ID from the URL. -
headers: HTTP headers. -
method: HTTP method (GET, POST, and so on).
-
-
Expand Variables to see Mule variables created by Transform Message components:
-
flightCodeMap: The flight code mapping. -
dbFlightId: The database ID for the flight.
-
-
To evaluate a DataWeave expression, in the Debug panel, locate the Watch section.
-
Click Add Expression to add a watch expression.

If the button doesn’t show, collapse and expand the Watch section so it shows again.
-
Enter a DataWeave expression, such as:
attributes.uriParams.flightId -
Press Enter.
The IDE evaluates the expression and displays the result.
-
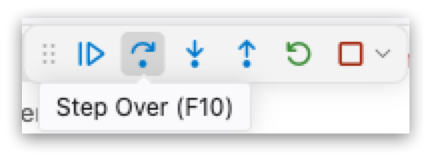
Click Step Over (or press F10) to continue the execution.
-
Execution stops at the Transform Flight component.
-
Expand Mule Message > Payload.
Notice that now the message contains the results from the database query.
-
Click Disconnect (SHIFT+F5) (
) to finish debugging.
Debug Error Paths
To understand how your API handles errors, debug the validation and error-handling logic.
-
Set breakpoints on:
-
The Choice router in
get:\flights\(flightId):american-flights-api-config. -
The Raise Error component inside the When path.
-
-
Start debugging and send an invalid request in your REST client:
GET http://localhost:8081/api/flights/AA999The execution pauses at the Choice router.
-
In Variables, inspect
dbFlightId(should benullbecauseAA999isn’t in the mapping). -
Click Step Over (F10).
Execution moves to the When path and pauses at Raise Error.
-
Click Step Over (F10).
Execution pauses at the On Error Propagate handler for
VALIDATION:FLIGHT_NOT_FOUND: -
In Parameters, verify:
-
type:VALIDATION:FLIGHT_NOT_FOUND -
description:"Flight code AA999 not found in our system"
-
-
Click Continue (F5) to complete the error response.
Once your application behaves as expected, add automated tests in Test the American Flights API with MUnit.