Using Logs in Anypoint Monitoring (Canada and Japan)
|
In the Canada and Japan Clouds, search for up to 30 days of logs across apps deployed to one of your organization’s environments.

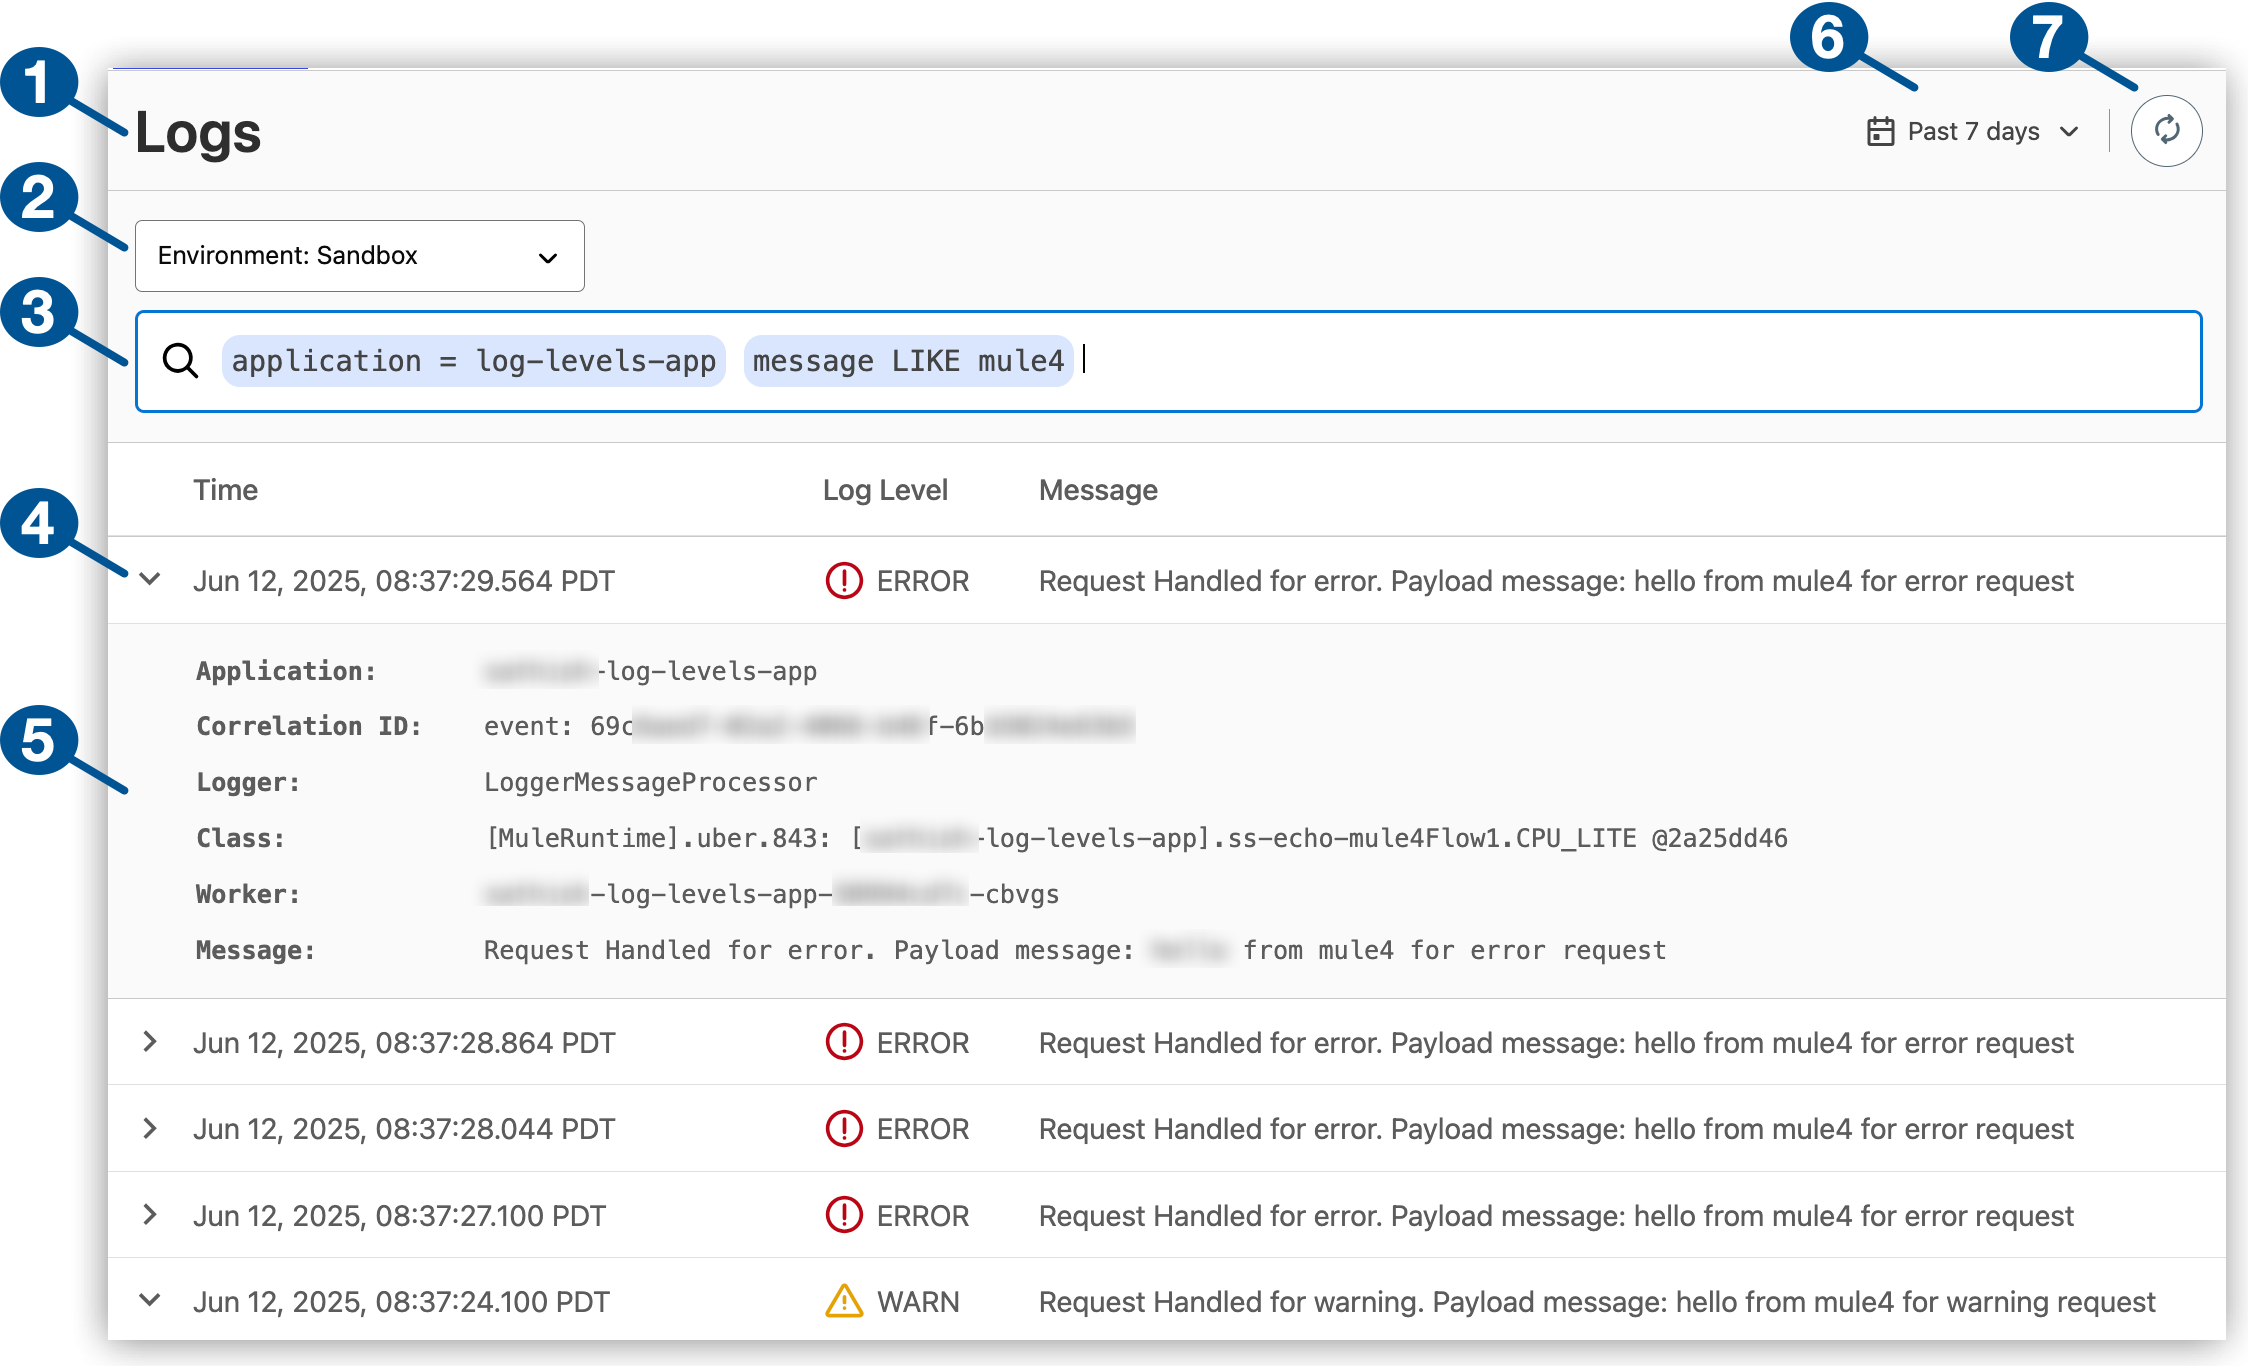
| 1 | Logs in Anypoint Monitoring |
| 2 | Environment selector for your deployments (such as Sandbox or Production) |
| 3 | Filters to narrow the list of logs that return |
| 4 | Matching log entry, which includes a date-time stamp, log level, and message |
| 5 | Expanded log message data and data available from other log fields |
| 6 | Selector for the date and time range to capture |
| 7 | Refresh button |
To view logs in other Anypoint Platform clouds, see Using Logs in Anypoint Monitoring (US and EU). To view single-application logs in Runtime Manager, see View Log Data.
Search for Logs
-
Select a date-time range (defaults to the last 15 minutes).
Built-in and custom selections are available for up to the last 30 days of logs for selected time ranges.
-
Select an environment.
-
To narrow the search results, provide a log query.
-
Review the search results.
You can expand a log entry to get additional details.
If no logs return, try a different date-time range, query, or environment. Also review the search query behavior.
View the Latest Logs
After a search query executes and produces log data (or no results), no new log data appears until you perform a new query, refresh, or reload the page.
To retrieve the latest log data, click Refresh.
Environments
When displaying logs, select the environment containing the applications you want to review.
Your organization administrator creates the environments that are available to you.
Anypoint Platform supports these types of environments:
-
Design
-
Production
-
Sandbox
Log Query Reference
Use these filters to narrow the results of your search for logs:
-
applicationaccepts an = operator followed by an application name. -
log_levelaccepts an = operator followed by a case-sensitive value of DEBUG, INFO, WARN, ERROR, or FATAL. -
messageaccepts a LIKE operator for partial matches in logmessagefields.
Search query behavior:
-
You can use any or all of the available filters in your query.
Multiple filters in a query are processed as logical ANDs (not ORs), meaning results must match all filter criteria not just some.
-
Multiple filters of the same type, such as two
applicationfilters, aren’t allowed. -
Each filter allows a single value.
-
For single-word search string values, you don’t need to add quotation marks around the string. For multi-word strings, manually surround the value in single quotes, such as
'error request'.


