View Log Data
CloudHub provides access to log data that includes deployment messages and events for each worker and Mule runtime engine logs.
Logs and diagnostics are currently available only for applications deployed to CloudHub workers. For applications deployed to a local server, you can send data to external analytics software. See Export Data to External Analytics Tools.
For more advanced searching and log management, you can:
-
Use Anypoint Monitoring.
-
Integrate your CloudHub app with your logging system using the Log4j configuration.
View Logs
To view logs for applications deployed to CloudHub:
-
In Anypoint Platform, select Runtime Manager.
-
In the Runtime Manager navigation menu, click Applications, and then click the application name.
-
In the navigation menu, click Logs.
-
In the Deployments section, filter the output by day, deployment, system log, and workers.
To remove a filter, deselect the checkbox for the date:
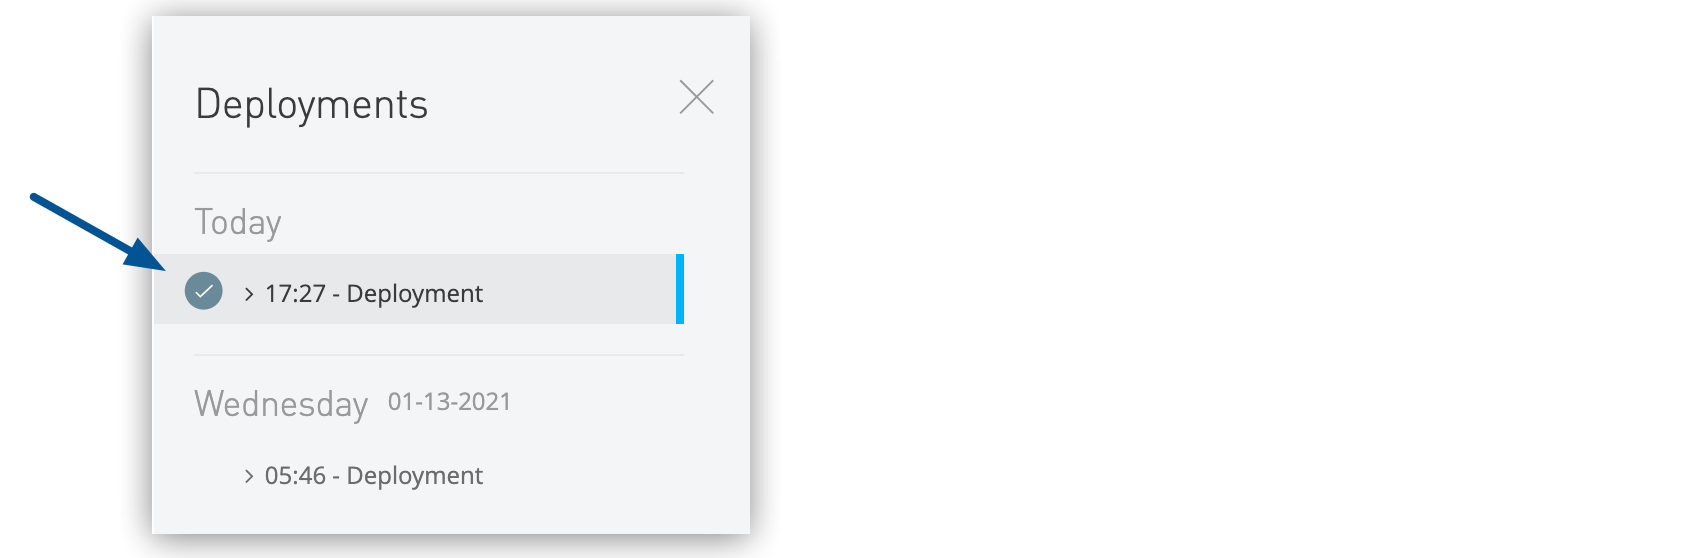 Figure 1. The arrow shows the checkbox to filter log output by deployment in the Deployments section.
Download Logs
For each worker in a CloudHub deployment, you can download logs specific to that worker’s activity:
-
In the Deployments section, select the date and worker for which you want to download logs.
-
Click the download icon for the worker and select Logs:
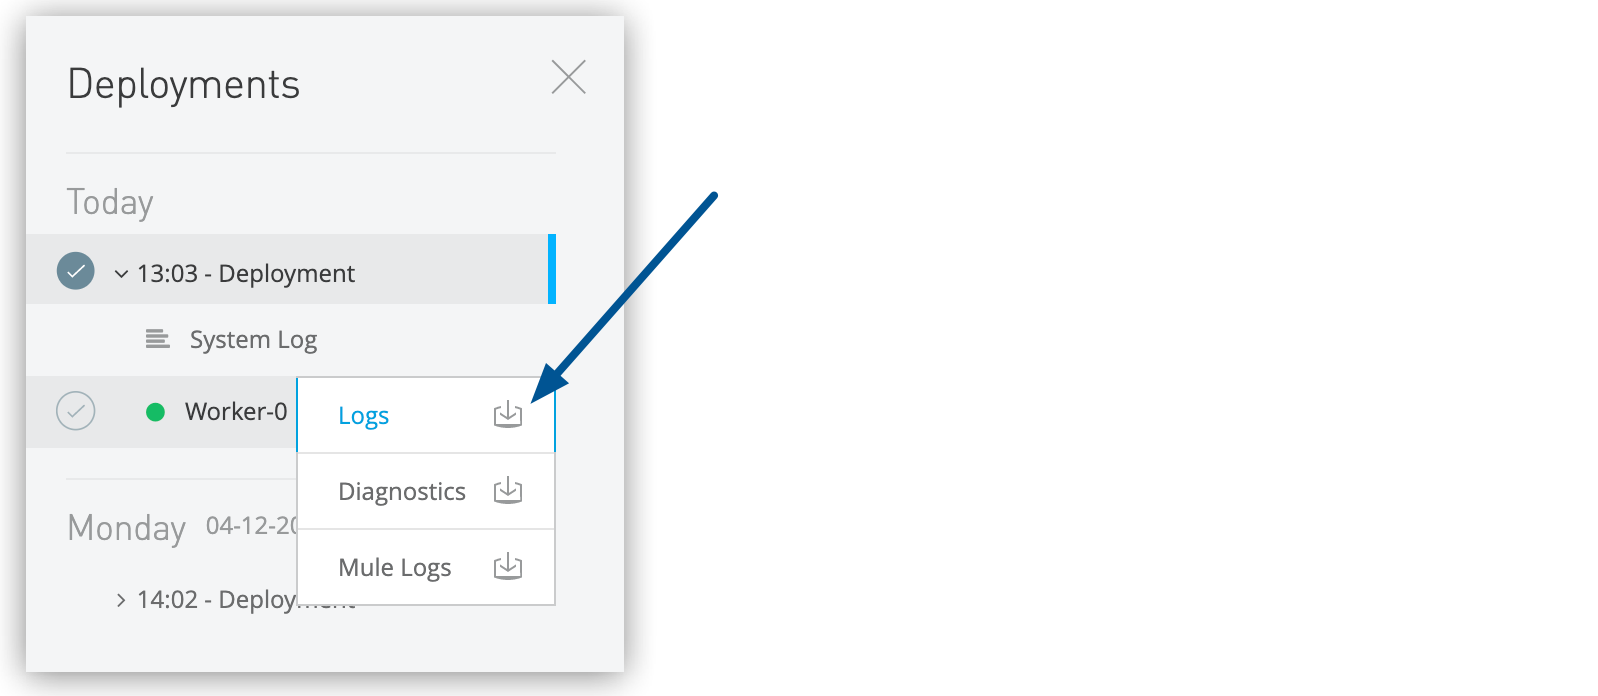 Figure 2. The arrow shows the icon to download log output by deployment in the Deployments section.
CloudHub downloads the log output to a text file in the format deploymentID.instanceID-workerNumber.log.
Use a text editor to view the log file.
To archive or download CloudHub application logs for audit, analytics, or other purposes at regular intervals, use the custom log appender to extract logs. See Integrate with Your Logging System Using Log4j.
Download Mule Logs
Mule logs display the logs of the Mule runtime engine for CloudHub. The Mule log contains information about app and lifecycle events. For example, the log records an entry when a Mule service or app starts, deploys, stops, or undeploys.
-
In the Deployments section, select the date and worker for which you want to download Mule logs.
-
Click the download icon for the worker and select Mule Logs:
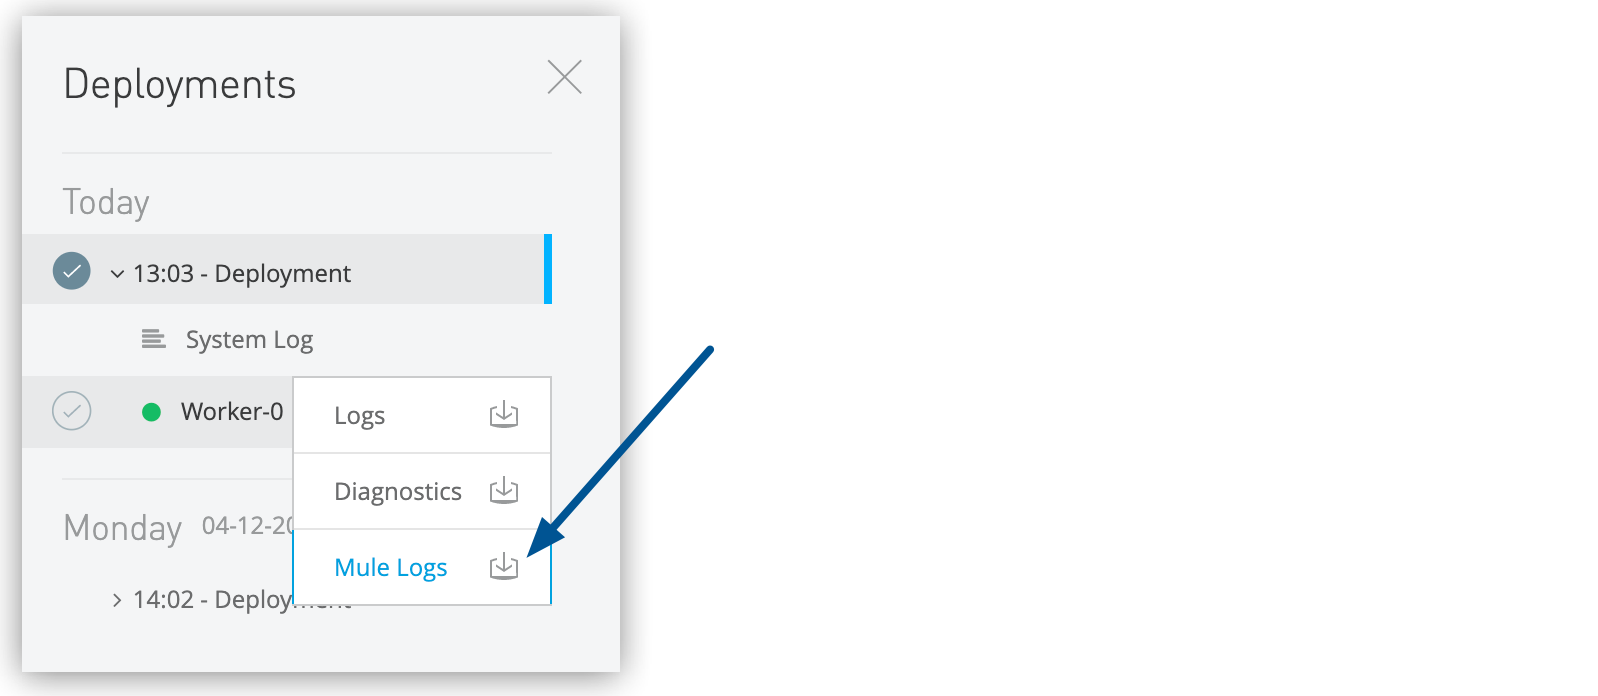 Figure 3. The arrow shows the icon to download Mule log output by deployment in the Deployments section.
CloudHub downloads the Mule log output to a text file in the format appName-instance-instanceID-workerNumber-mule_ee.log.
Use a text editor to view the log file.
For more information about Mule logs, see Runtime Log.
Deployment History Persistence
CloudHub stores up to 30 days of inactive deployments history based on the last modified time of the deployment.
Log Persistence
CloudHub stores up to 100 MB of log data per application per worker, or up to 30 days, whichever limit is reached first.
Log Timezones
CloudHub stores log data in Universal Time (UTC); however, the console displays the log using your computer’s local time zone.
Retrieve Logs Using the CloudHub API
To retrieve application logs programmatically, use the CloudHub API log endpoints. See CloudHub API Reference.
When filtering by time range, the startTime and endTime parameters require ISO 8601 UTC format with microsecond precision (YYYY-MM-DDTHH:mm:ss.SSSSSSZ), for example, 2025-12-25T10:00:00.000000Z. These parameters don’t accept epoch (Unix) timestamps.
Search Logs
Search for logs that contain specified values or search for logs by date and priority.
To search logs:
-
Enter a value in the search box, or click Advanced to search for logs for a specified time, day, date range, and message priority.
-
Click Apply.
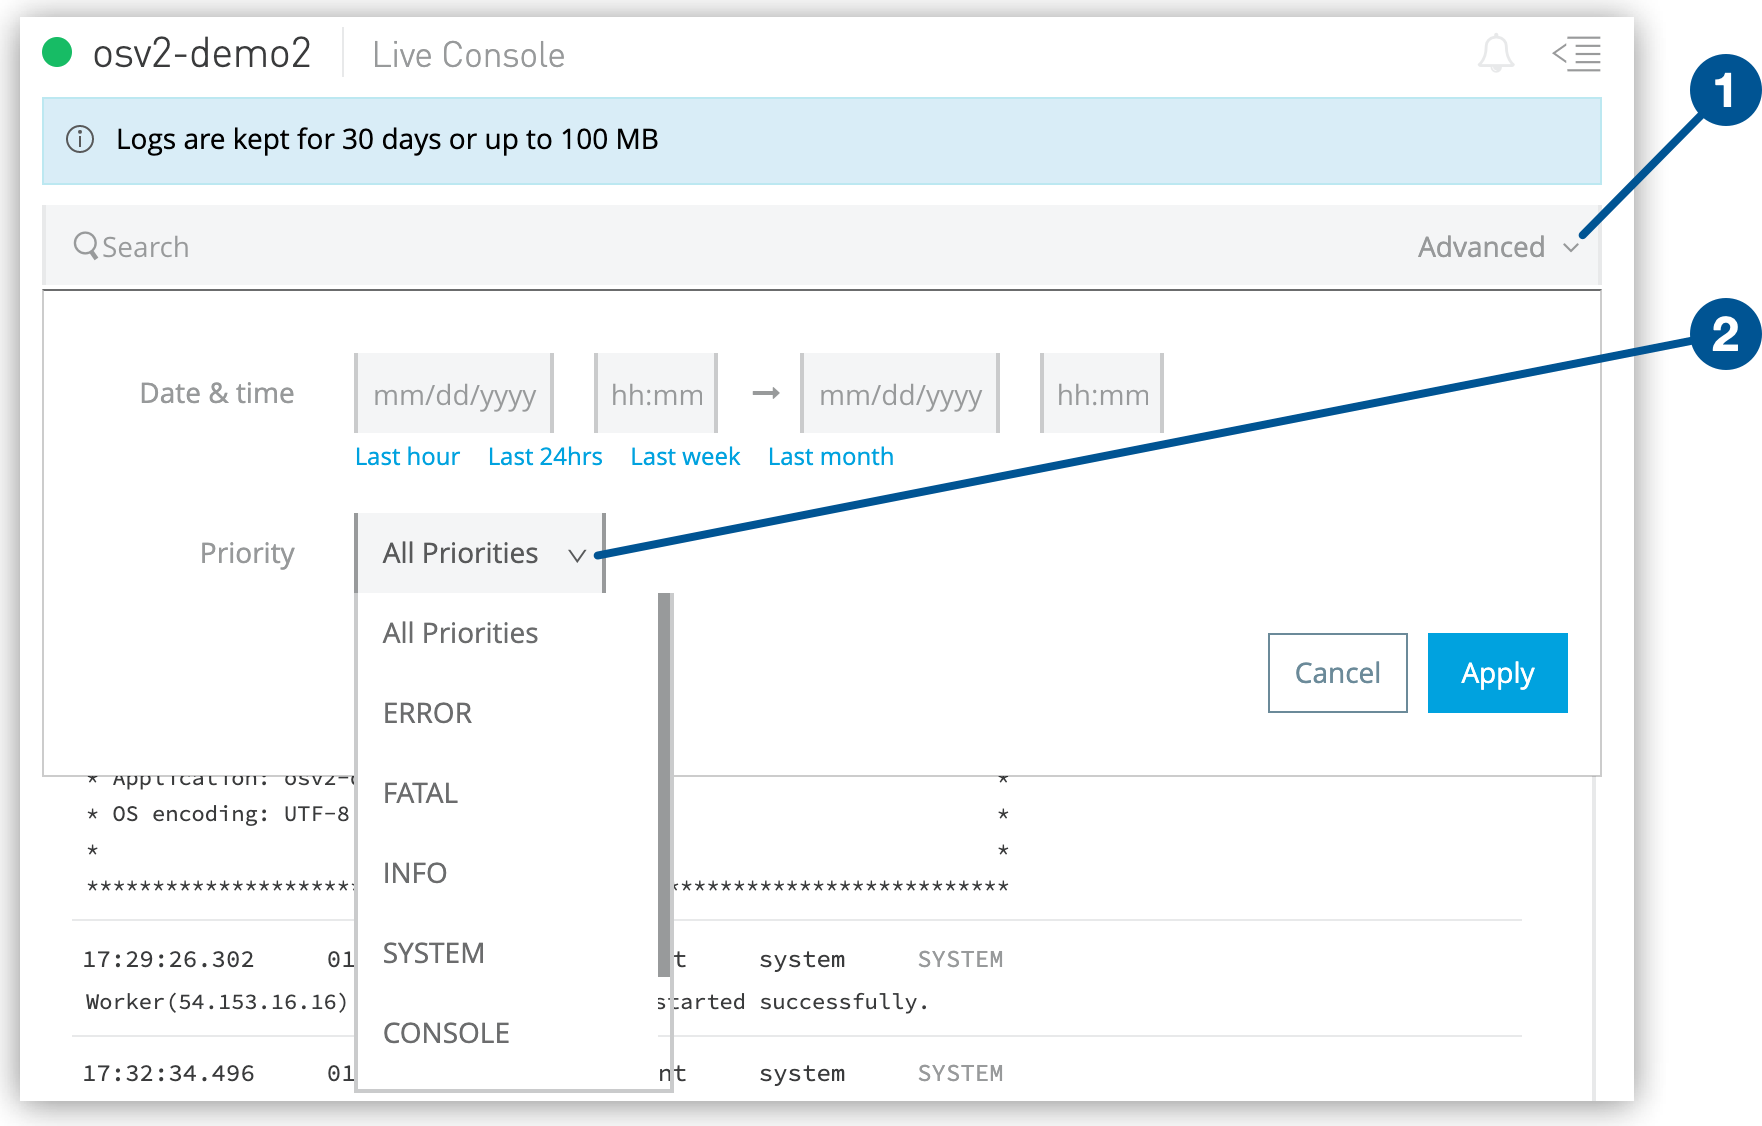 Figure 4. The screenshot shows (1) Advanced search and (2) Priority on the Logs page.
You can search with queries. For more information, see Log Search Syntax.
Search by Date and Time
The Date & Time filter lets you search the log by specifying a date range. Possible values are:
-
Last hour
-
Last 24 hours
-
Last week
-
Last month
Search by Message Priority
The Priority filter lets you view specific events in the log. You can also specify different priorities by typing priority<type> in the search box, as shown in the Command column in the table.
Possible values are:
| Value | Description | Command |
|---|---|---|
All Priorities |
List all messages |
N/A |
|
List only error messages, such as when an exception occurs. |
priority:ERROR |
|
List only fatal messages for when an application fails |
priority:FATAL |
|
List informative messages |
priority:INFO |
|
List messages about application and worker startup |
priority:SYSTEM |
|
List message about console events such as setting the object store |
priority:CONSOLE |
|
List warning messages |
priority:WARN |
|
List debugging messages |
priority:DEBUG |
| Heap dumps cannot be shared. Instead, our Support Center representatives can analyze the dumps and share the required information with you. |