
Export Data from Runtime Manager to External Analytics Tools


You can configure the Runtime Manager agent to export data to external analytics tools.
Using either the Runtime Manager cloud console or Anypoint Platform Private Cloud Edition, you can:
-
Send Mule event notifications, including flow executions and exceptions, to Splunk or ELK.
-
Send API Analytics to Splunk or ELK.
If you plan to export your payload’s contents to be logged, consider that not all formats can be exported. See Payload Formats and Logging.
Sending data to third-party tools is not supported for applications deployed on CloudHub. You can use the CloudHub custom log appender to integrate with your logging system. See Integrate with Your Logging System Using Log4j.
Prerequisites
Ensure that the following software is installed:
-
Mule runtime engine
To forward events from API analytics to both an external tool and Anypoint Platform, the following version is required:
-
Mule version 4.2.0 or later
-
-
API gateway standalone version 2.1.0 or later
-
Runtime Manager agent 1.2.0 or later
To send data to Splunk using the HTTP Event Collector or over TCP, Runtime Manager agent 1.3.1 or later is required.
For information about updating the agent, see Install or Update the Runtime Manager Agent.
Splunk Prerequisites
To send data to Splunk using the HTTP Event Collector, you must first set up the data input and obtain a token from Splunk:
-
Sign in to your Splunk account.
-
Navigate to Settings > Data Inputs.
-
For the HTTP Event Collector type, click Add new.
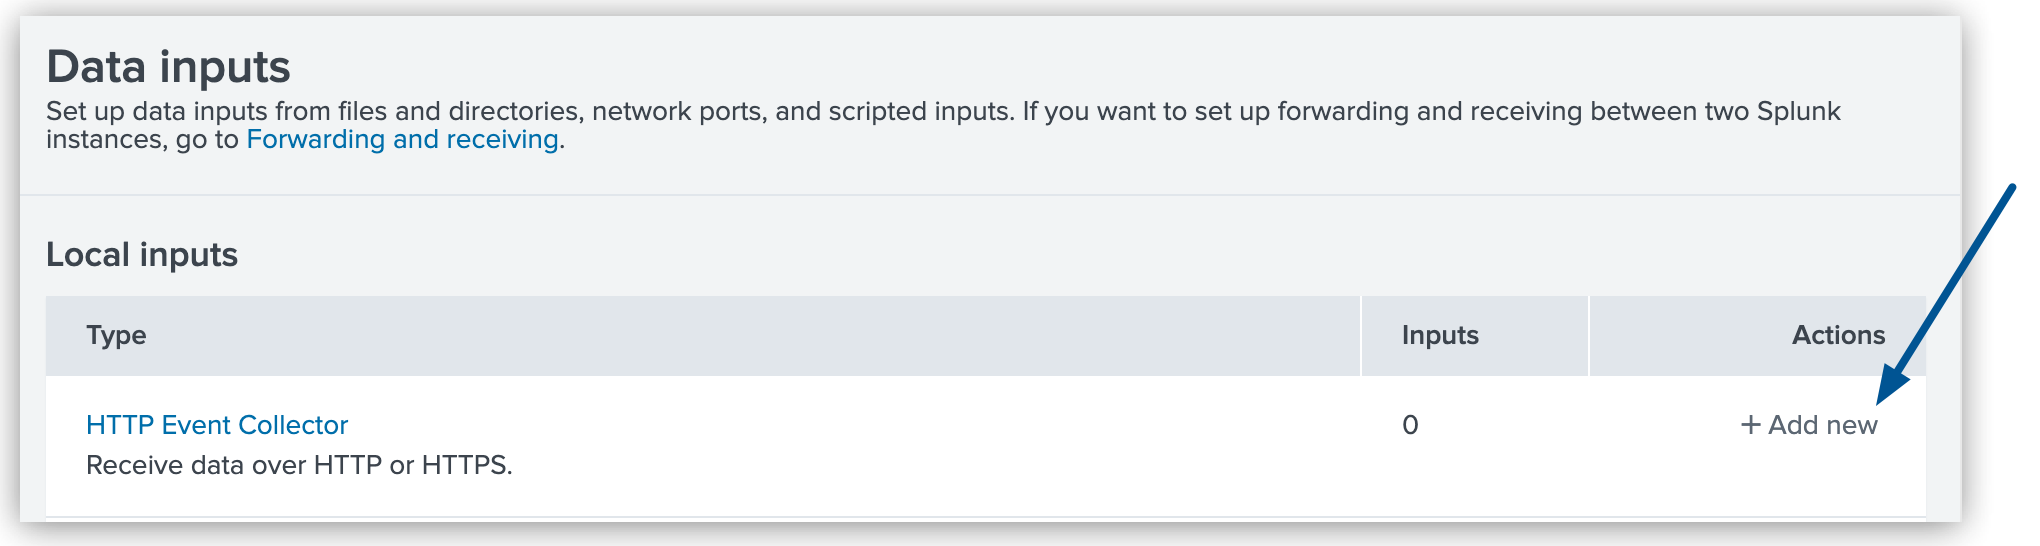 Figure 1. The arrow shows the Add new option for the HTTP Event Collector in the Splunk Data Inputs page.
 -
Follow the steps to set up the data input and obtain the token.
To send data to Splunk over TCP, you must first enable the input source in Splunk:
-
Sign in to your Splunk account.
-
Navigate to Settings > Data Inputs.
-
For the TCP type, click Add new.
 Figure 2. The arrow shows the Add new option for TCP in the Splunk Data Inputs page.
 -
Follow the steps to set up the data input.
For more information about setting up data inputs, see the Splunk documentation.
Logging-Level Options
The following logging levels are available when configuring integration with Splunk or ELK:
- Business Events
-
Flow start or end, async messages, exceptions, and custom events
- Tracking
-
Business Events plus exception strategy, and endpoint messages
- Debug
-
Tracking plus message processor begin and end
Integrate with Splunk
With Splunk, you can capture and index Mule event notification data into a searchable repository from which you can then generate graphs, reports, alerts, dashboards, and visualizations.
Configure the Agent in Your Splunk Instance
To integrate with Splunk, you must create and configure a new source type on your Splunk instance that can parse the HTTP events sent by the Runtime Manager agent.
-
If necessary, create the
$SPLUNK_HOME/opt/splunk/etc/system/local/props.conffile. -
Append the following source type to the
props.conffile:[mule] TRUNCATE = 0 LINE_BREAKER = ([\r\n]+) SHOULD_LINEMERGE = false INDEXED_EXTRACTIONS = JSON KV_MODE = JSON category = Mule Splunk Integration description = Mule Agent event information -
Restart your Splunk instance for your changes to take effect.
Configure Splunk Integration in Runtime Manager
To send Mule event notifications from the Runtime Manager agent to Splunk:
-
If you plan to send data to Splunk using the HTTP Event Collector or over TCP, check the Splunk Prerequisites.
-
From Anypoint Platform, select Runtime Manager.
-
Click the Servers tab.
-
Click the Type column to display the details pane for the server you want to configure.
-
Click Manage Server.
-
Click the Plugins tab:
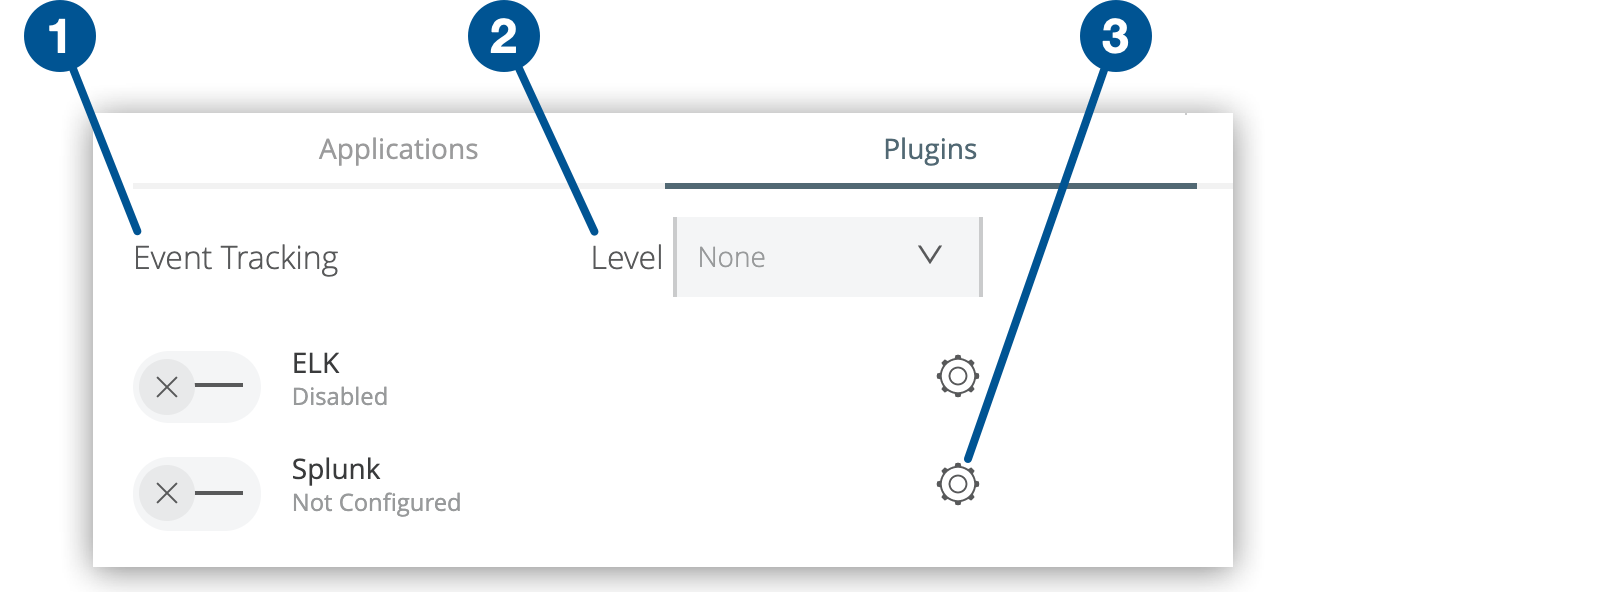 Figure 3. The screenshot shows (1) the Event Tracking options, (2) the Level menu, and (3) the gear icon on the server Plugins tab.
 -
Under Event Tracking, enable Splunk.
-
Select the type of information to send from the Level menu.
-
Click the gear icon to specify your Splunk configuration:
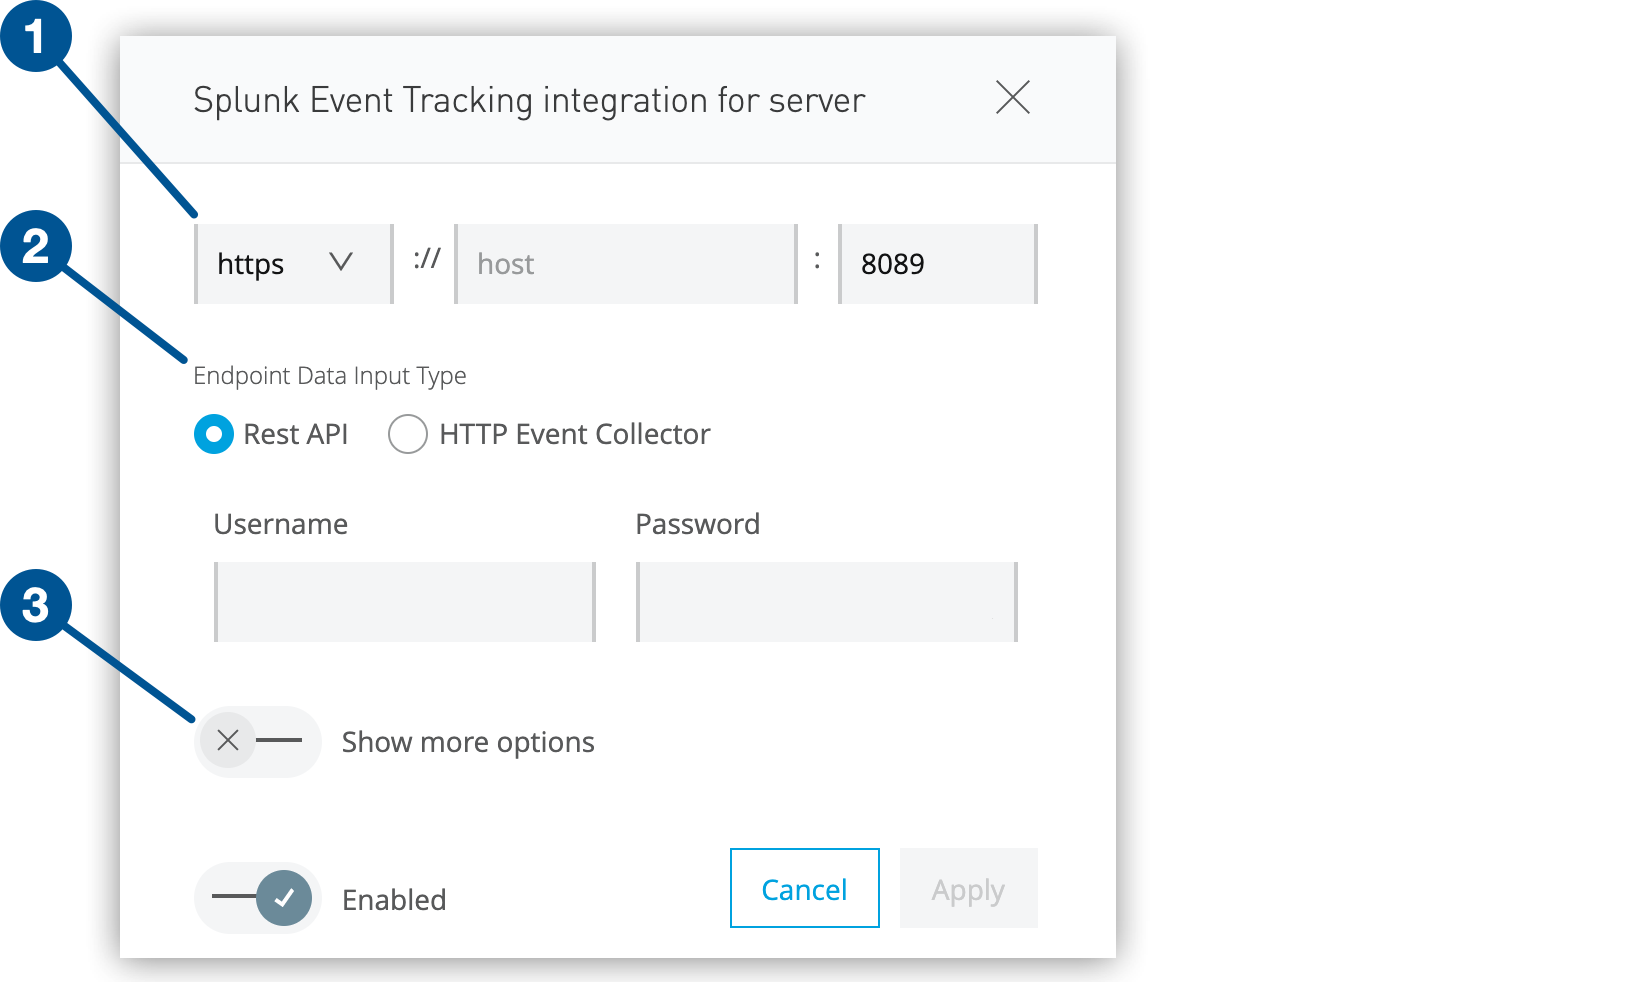 Figure 4. The screenshot shows (1) the protocol option, (2) the data input types, and (3) the Show more options switch in the Splunk configuration window.
 -
Specify the host (IP address or hostname) and management port of the server where Splunk is running.
-
To send data to Splunk using the REST API, select Rest API and enter the username and password for your Splunk account.
-
To send data to Splunk over TCP, select tcp from the menu and enter the username and password for your Splunk account.
-
To send data to Splunk using the HTTP Event Collector, select HTTP Event Collector and paste the token from Splunk in the Token field:
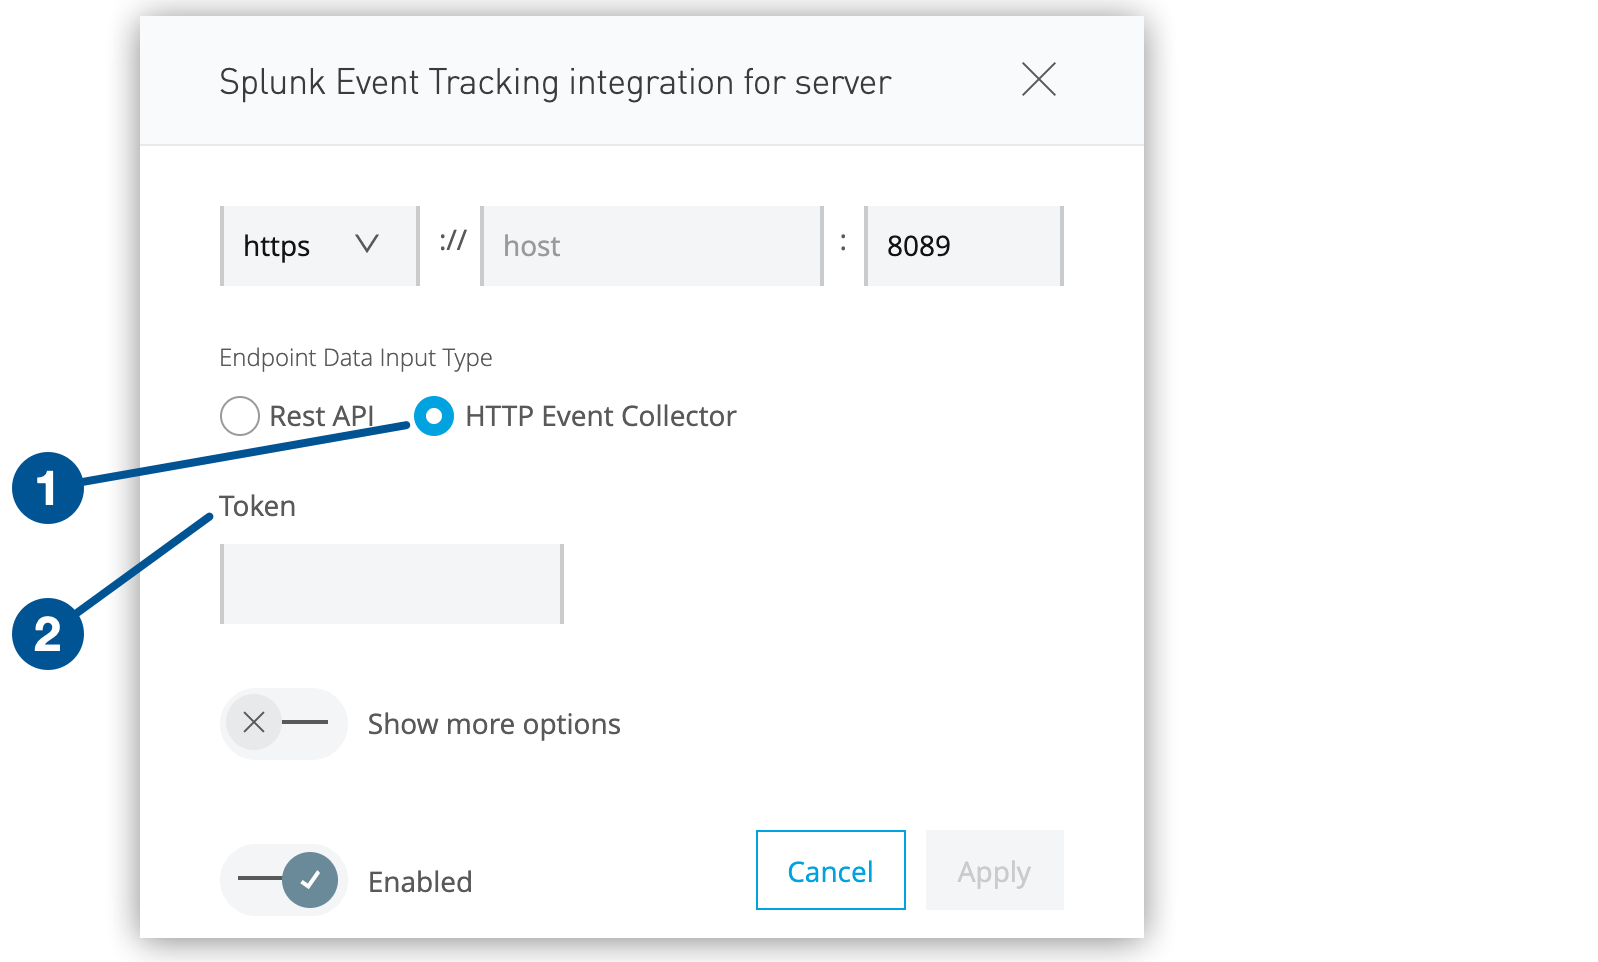 Figure 5. The screenshot shows (1) the HTTP Event Collector option and (2) the Token field in the Splunk configuration window.
-
-
If you want, click Show more options to specify formatting properties for the sent data:
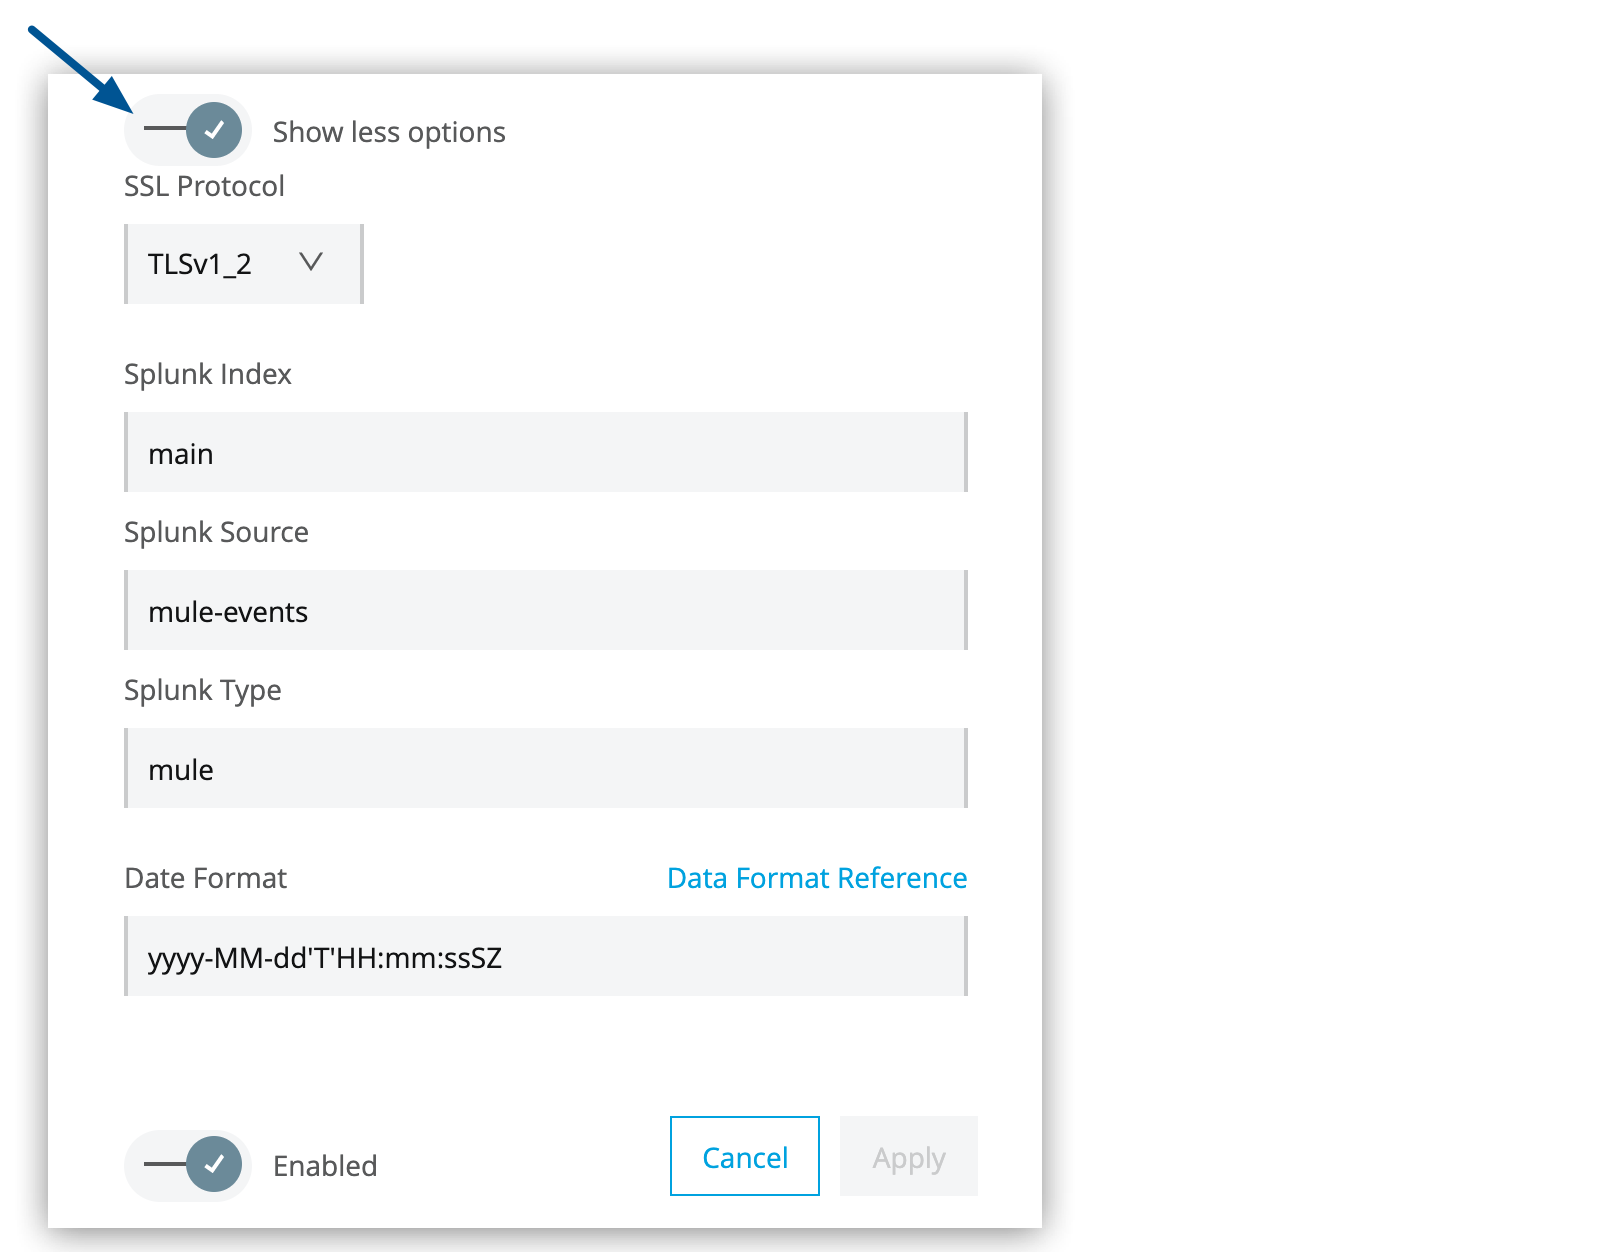 Figure 6. The arrow shows the expanded options in the Splunk configuration window.
The SSL Protocol option applies only to the REST API data input type.
If you set values for the Splunk index, Splunk source, and Splunk source type when you registered your data input in Splunk, any values you specify in this window overwrite those values. -
Click Apply to save your changes.
Splunk Configuration Options
Splunk integration includes the following configuration options:
| Field | Description | Default Value |
|---|---|---|
Username (Required) |
Username to connect to Splunk |
|
Password (Required) |
Password associated with the Splunk username |
|
host (Required) |
IP address or hostname of the server where Splunk is running |
|
port |
Splunk management port |
8089 |
protocol |
Protocol for the connection to the Splunk management port Possible values are http, https, and tcp. |
https |
SSL Protocol (REST API only) |
SSL Security Protocol to use for the HTTPS connection Possible values are TLSv1_2, TLSv1_1, TLSv1, and SSLv3. |
TLSv1_2 |
Splunk Index |
Name of the Splunk index to send all events to If the index doesn’t exist, the internal handler creates it if the permissions associated with the username are adequate. |
main |
Splunk Source |
The source used for events sent to Splunk |
mule-events |
Splunk Type |
The source type used for events sent to Splunk |
mule |
Date Format |
Date format to use to format the timestamp |
yyyy-MM-dd’T’HH:mm:ssSZ |
Integrate with Your ELK Stack
The ELK (Elasticsearch, Logstash, Kibana) stack enables you to store, search, and analyze the log data.
You can configure the Runtime Manager agent to send event notifications from Mule flows to a configurable log file. Logstash first captures and indexes the data. Then, you can use Elasticsearch and Kibana to generate graphs, reports, alerts, dashboards, and visualizations.
Configure the Log File for Your ELK Stack
To send event notifications to the folder from which your ELK stack reads:
-
From Anypoint Platform, select Runtime Manager.
-
Click the Servers tab.
-
Click the Type column to display the details pane for the server you want to configure.
-
Click Manage Server.
-
Click the Plugins tab:
Figure 7. The screenshot shows (1) the Event Tracking options, (2) the Level menu, and (3) the gear icon on the server Plugins tab. -
Select the type of information to send from the Level menu.
-
Under Event Tracking, enable ELK.
-
Click the gear icon to configure the log file location for ELK:
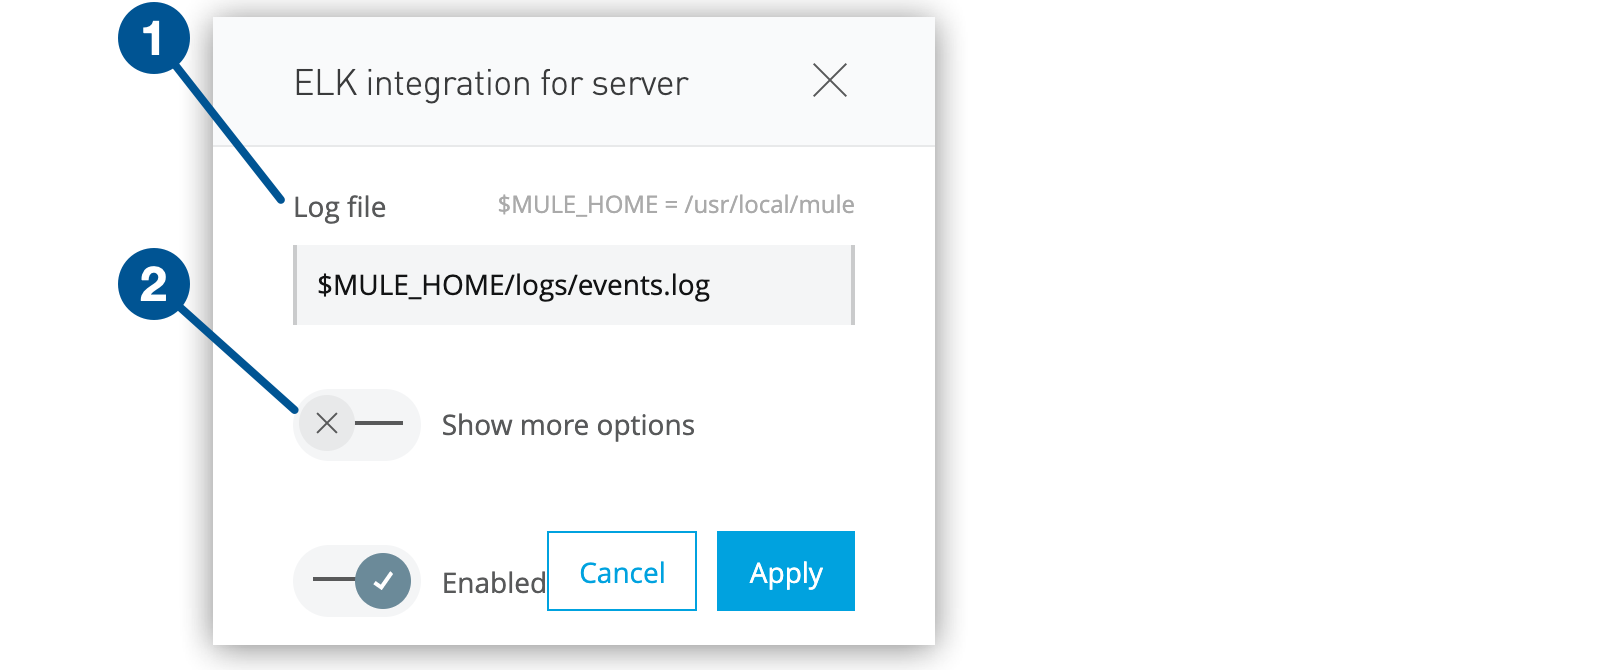 Figure 8. The screenshot shows (1) the log file location and (2) the Show more options switch in the ELK configuration window.
The default location is
$MULE_HOME/logs/events.log, where$MULE_HOMEis the location specified by the-Dmule.homeparameter in thewrapper.conffile. To change the default location, specify the absolute path for the location of your ELK log file, such as/var/logs/elk/events.log. The specified directory, such as/var/logs/elk, must exist. -
If you want, click Show more options to specify additional properties for the log file:
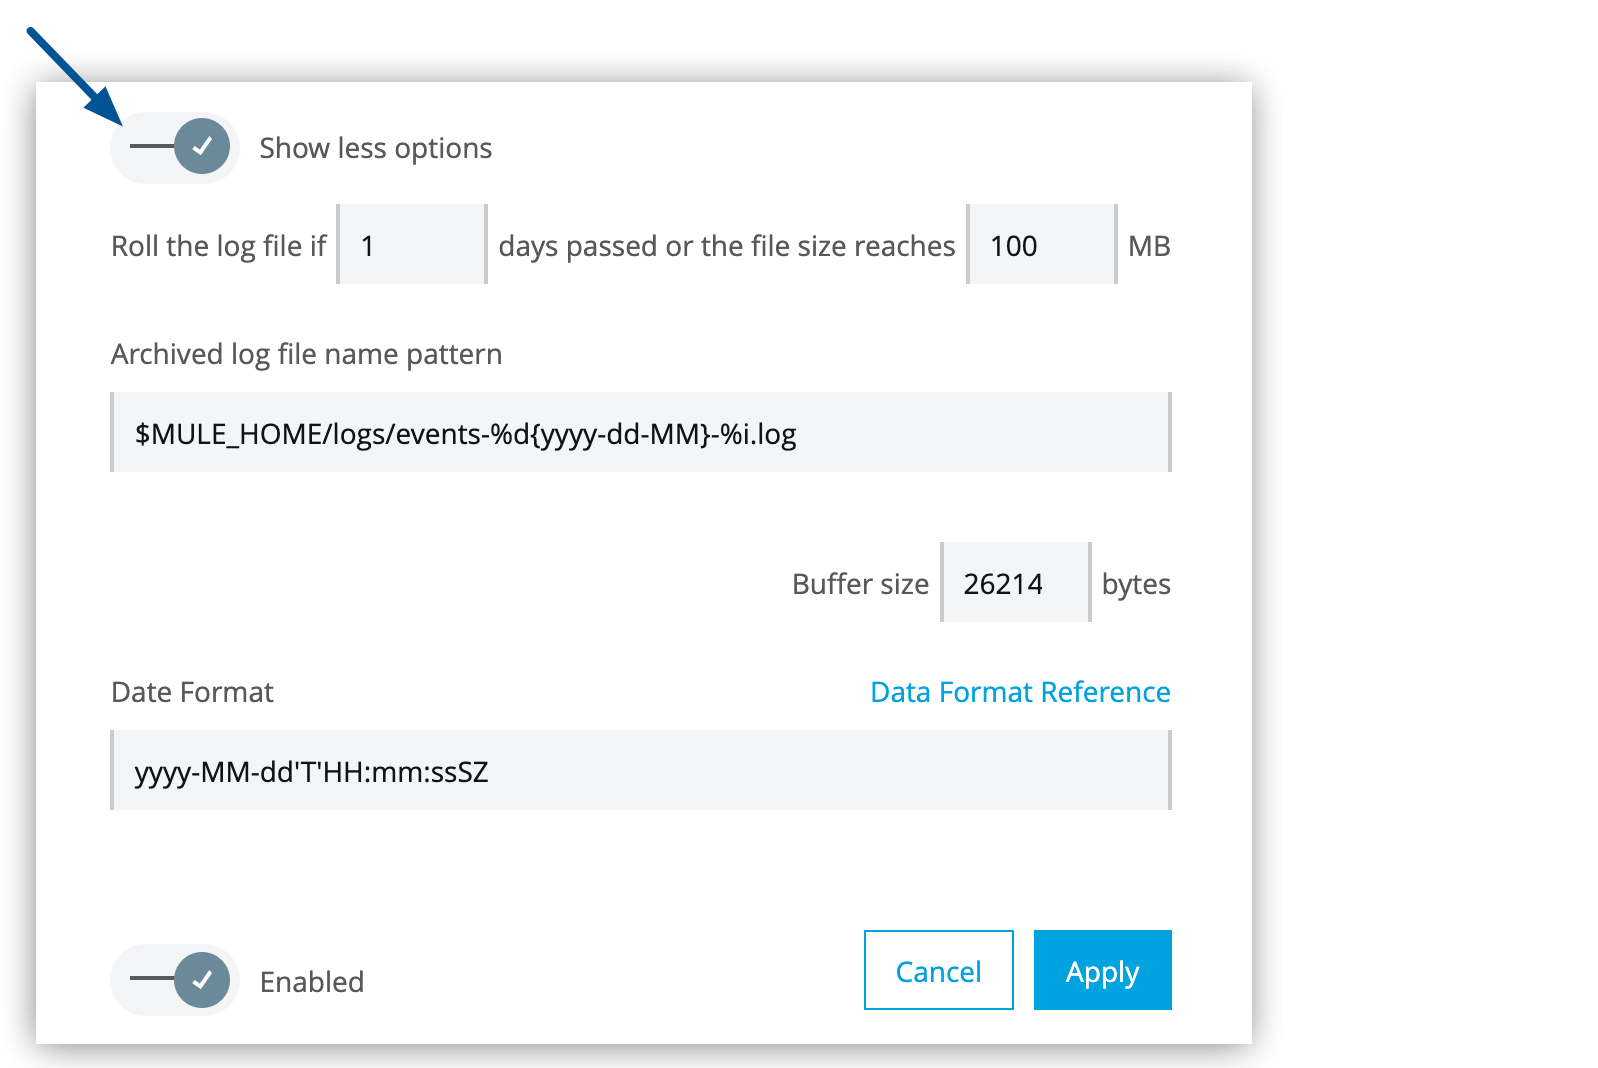 Figure 9. The arrow shows the expanded options in the ELK configuration window.
 -
Click Apply to save your changes.
The event tracking log file ($MULE_HOME/logs/events-%d{yyyy-dd-MM}-%i.log) is not automatically deleted. You must manually delete the logs periodically.
|
Integrate API Analytics with Splunk or ELK
To integrate API Analytics with Splunk or ELK:
If you configure the API gateway wrapper.conf (Step 1) but don’t assign an external destination for your data (Step 2), the analytics data accumulates in a queue in the API gateway server, which could cause the system to crash.
|
Configure the API Gateway
To set up the connection to external analytics tools, configure the API gateway:
-
In your API gateway standalone directory, open the
conf/wrapper.conffile.The
.<n>value in the code snippets refers to an integer that is unique withinwrapper.conf. -
Ensure that the following property is set to
trueand that the line is uncommented:wrapper.java.additional.<n>=-Danypoint.platform.analytics_enabled=true -
Remove the URL from the following line:
wrapper.java.additional.<n>=-Danypoint.platform.analytics_base_uri=https://analytics-ingest.anypoint.mulesoft.comThe line now looks like the following:
wrapper.java.additional.<n>=-Danypoint.platform.analytics_base_uri= -
For Anypoint Platform Private Cloud Edition, change the
anypoint.platform.on_premparameter totrue:wrapper.java.additional.<n>=-Danypoint.platform.on_prem=trueIf you are using the Runtime Manager cloud console, leave this parameter set to the default value,
false.
Configure Multiple Consumers
For Mule versions 4.2.0 and later, you can forward events to both an external tool and Anypoint Platform.
To configure multiple consumers, add the following line to the wrapper.conf file:
wrapper.java.additional.<n>=-Danypoint.platform.analytics_multiple_consumers_enabled=trueConfigure API Analytics to Connect with Splunk or ELK
After you configure your API gateway, configure Splunk or ELK in Runtime Manager:
-
From Anypoint Platform, select Runtime Manager.
-
Click the Servers tab.
-
Click the Type column to display the details pane for the server you want to configure.
-
Click Manage Server.
-
Click the Plugins tab:
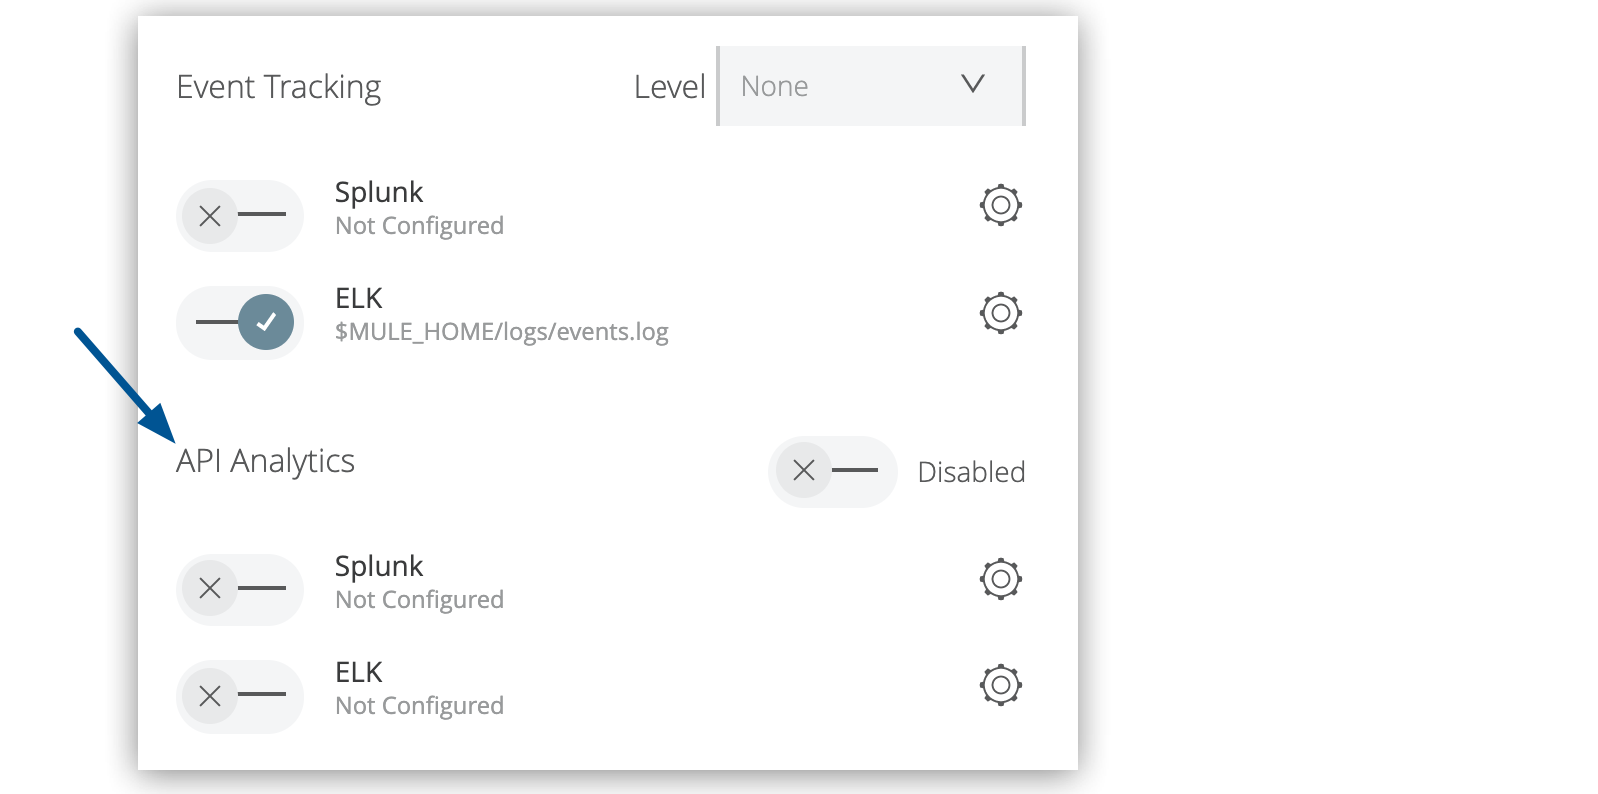 Figure 10. The arrow shows the API Analytics options on the server Plugins tab.
 -
Under API Analytics, enable ELK or Splunk.
-
Click the gear icon and continue with Step 8 in the following sections to complete the configuration: