Using Coverage in Studio
You can run a coverage report from Anypoint Studio.
Enabling Coverage Reports in Anypoint Studio
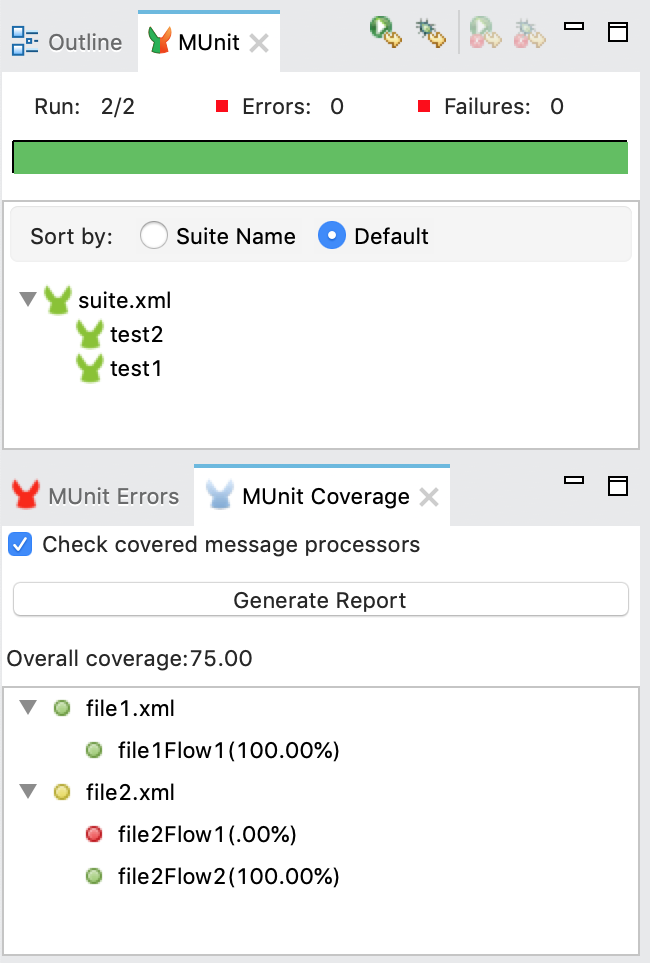
The Coverage button in the image bellow allows you to see which flows, and which percentage of event processors in those flows were covered by the test:

The Overall Coverage value represents the percentage of the Mule application event processors that have been executed by the MUnit test.
You can click the Generate Report button to get the report detailing the flows and event processors contained by the Mule configuration files that were included in the MUnit test.
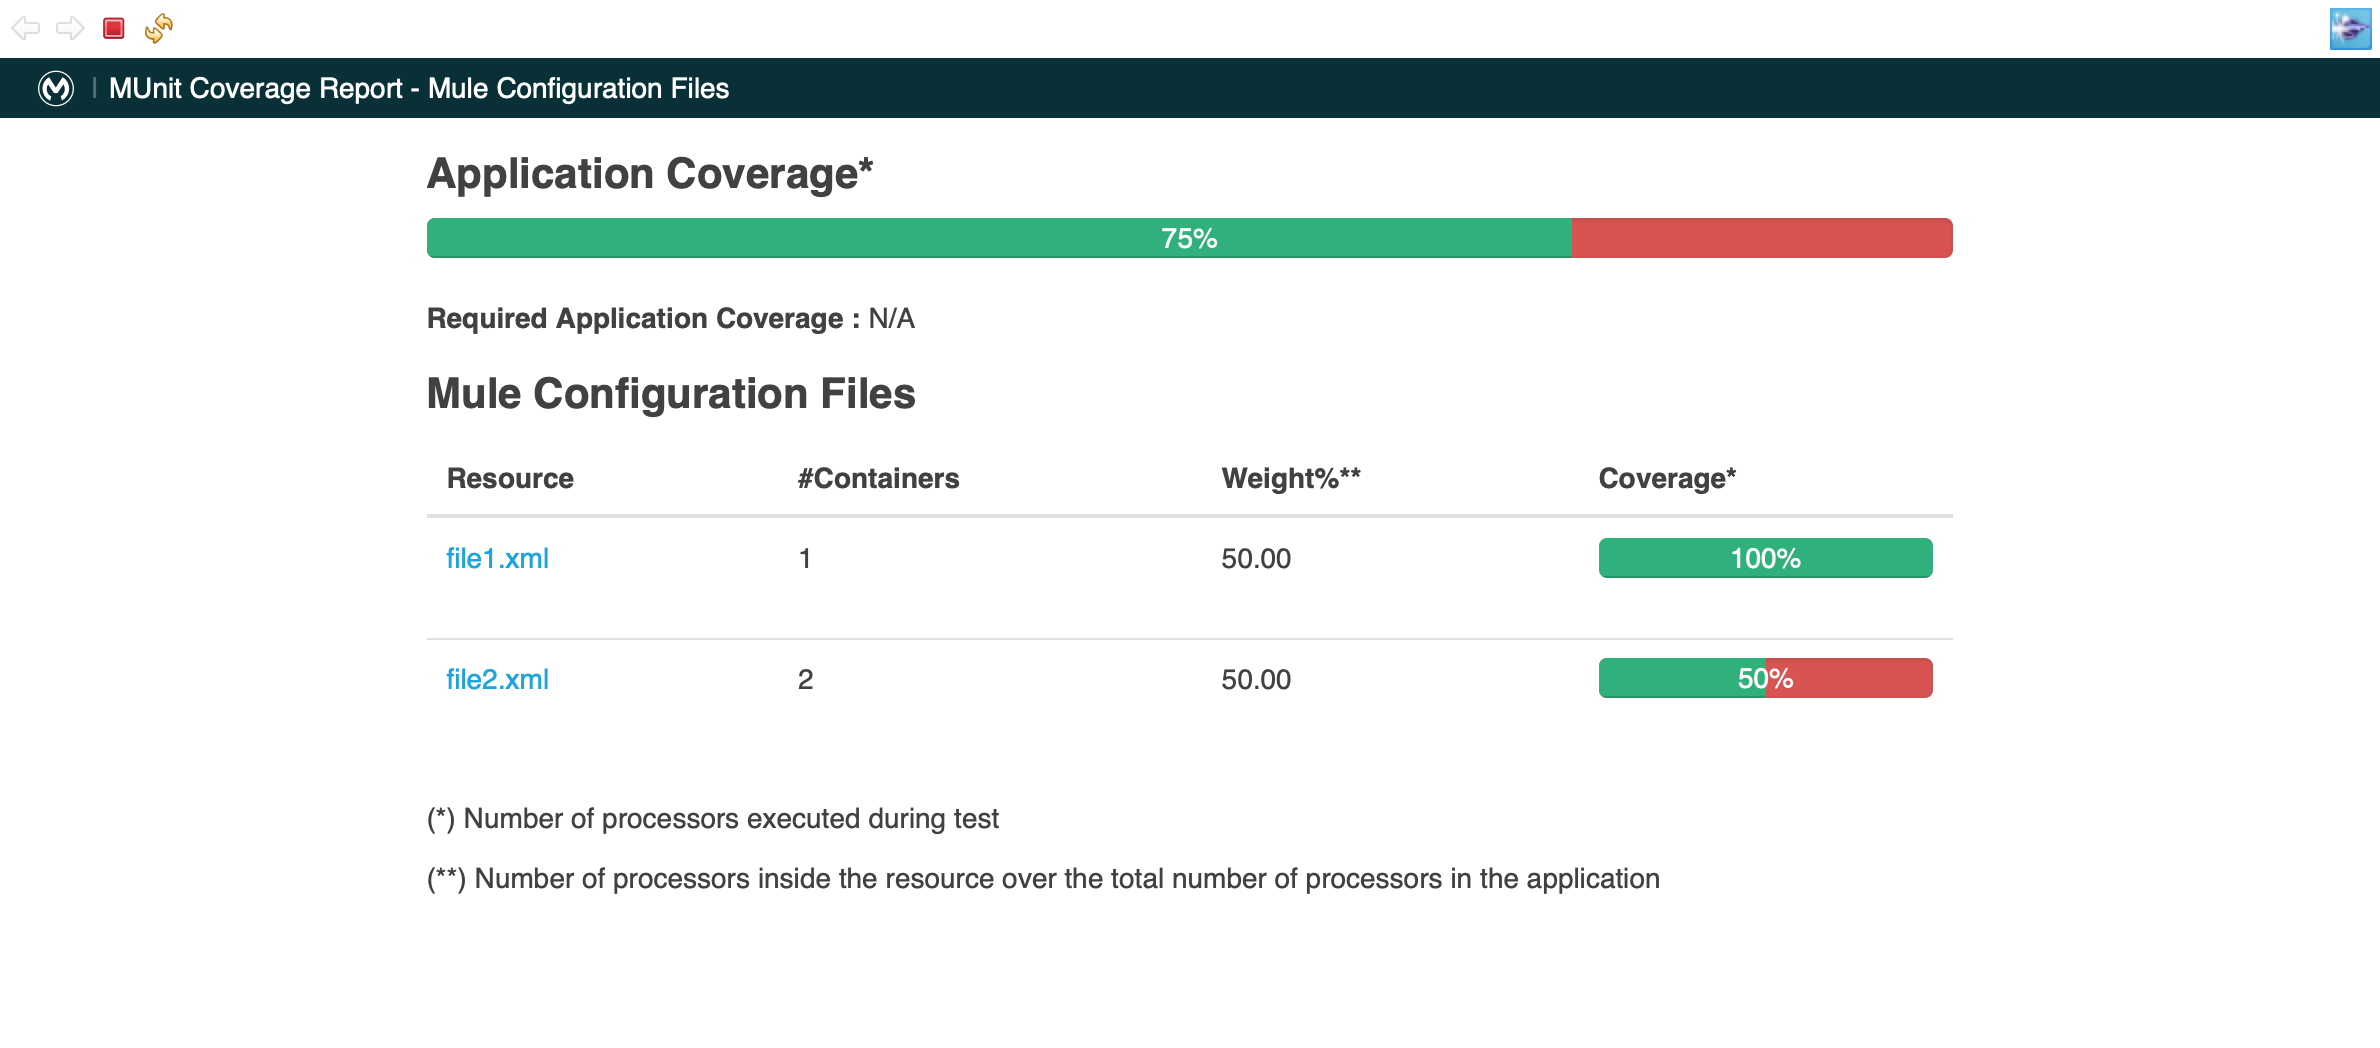
| Column | Description |
|---|---|
Resource |
The name of the Mule Configuration file. |
Containers |
Number of Flows inside the Mule configuration file. |
Weight |
This field represents how much of your application is contained inside a configuration file. |
Coverage |
This field represents the percentage of the event processors inside the Mule Configuration file that were executed in the MUnit test. |
Additionally you can click in each Resource, to get a more specific and granular report of the Event Processors executed in that resource:
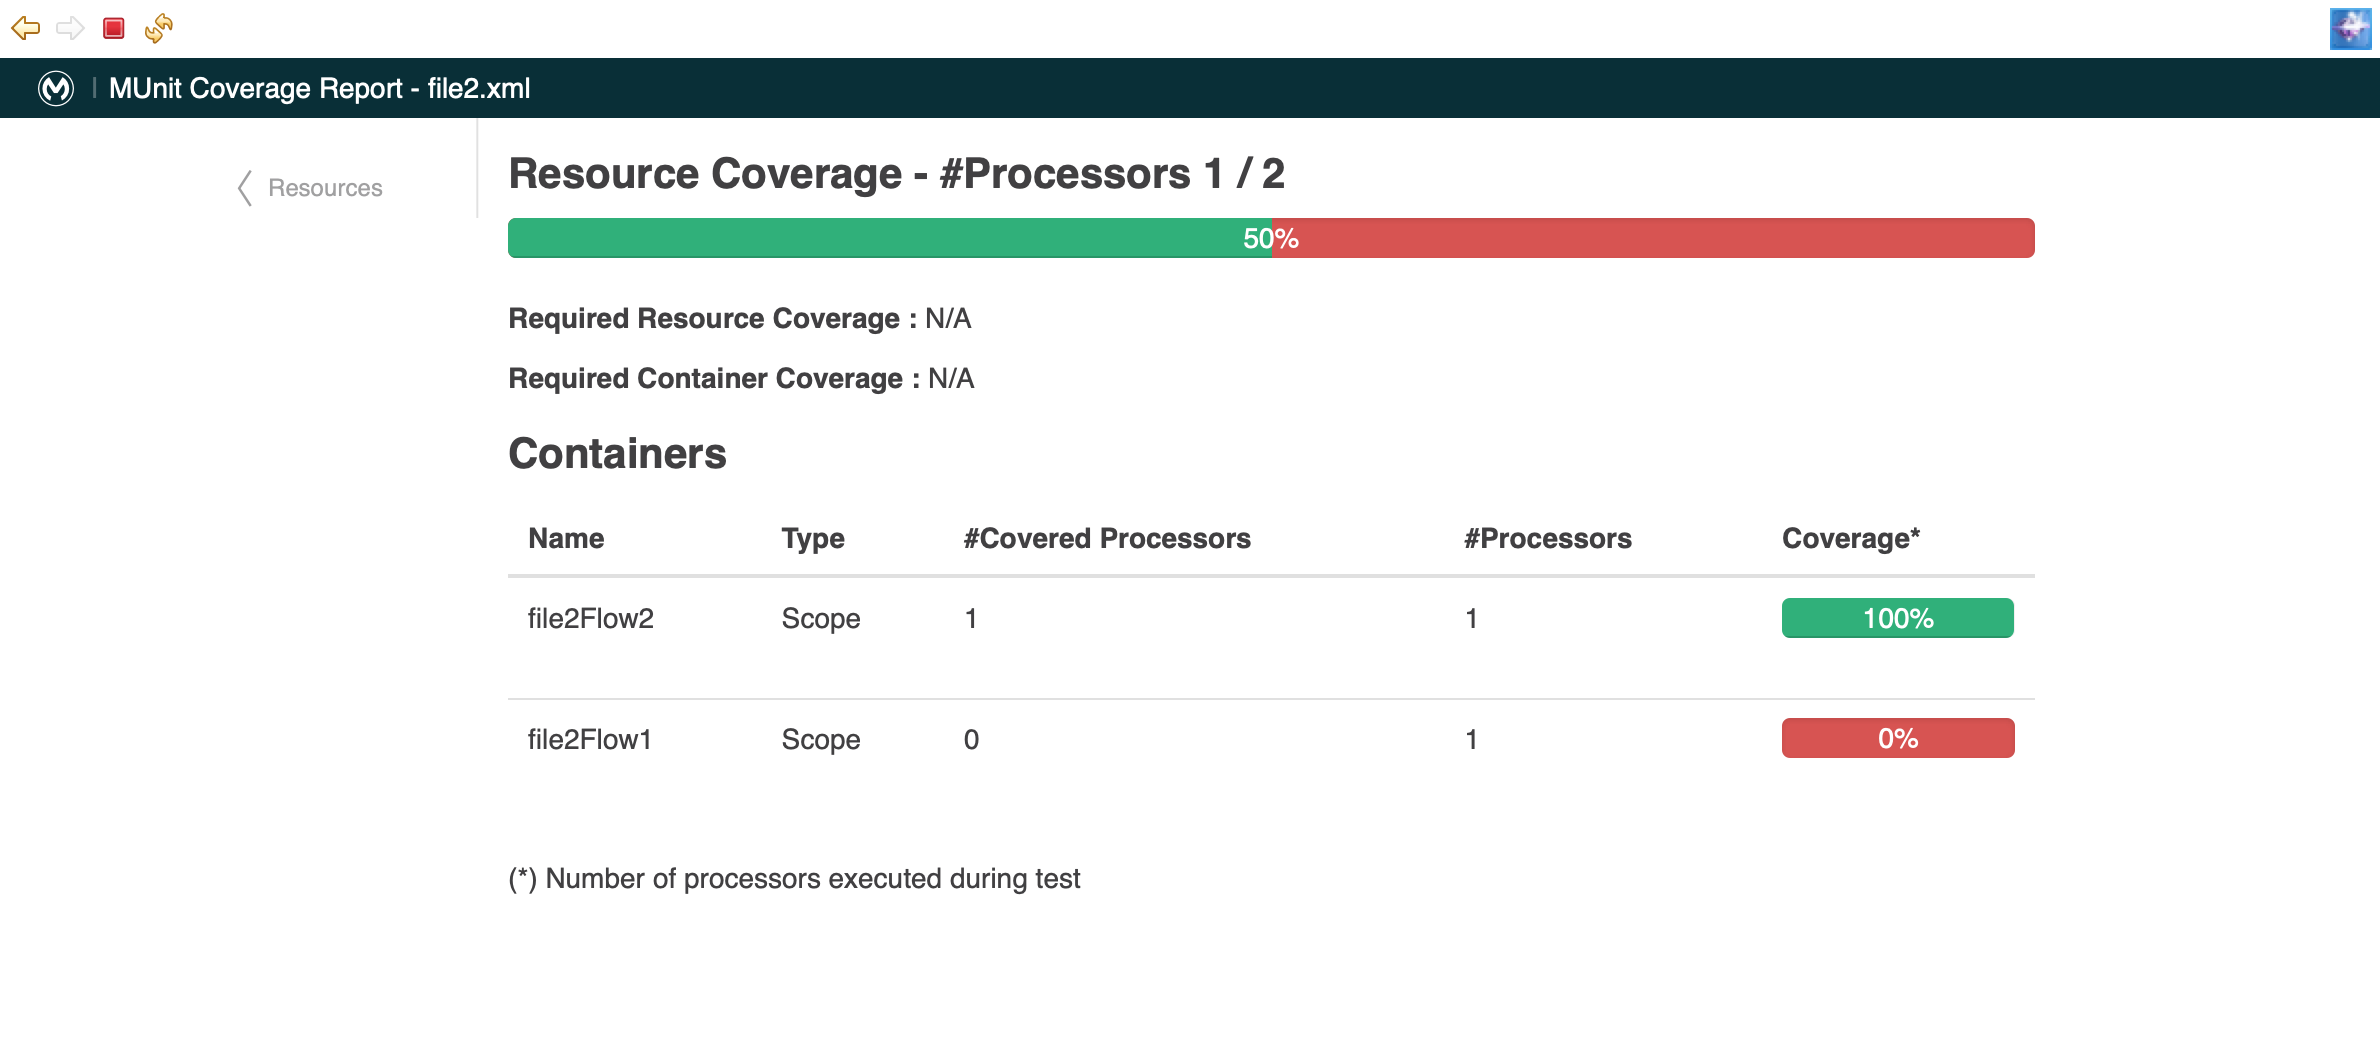
| Column | Description |
|---|---|
Name |
The name of the container. |
Type |
The type of the container. |
Covered Processors |
The processors inside the container that were executed during the MUnit test. |
Processors |
The total amount of processors inside the container. |
Coverage |
This field represents the percentage of the event processors inside the container that were executed in the MUnit test. |
Disabling Coverage Reports
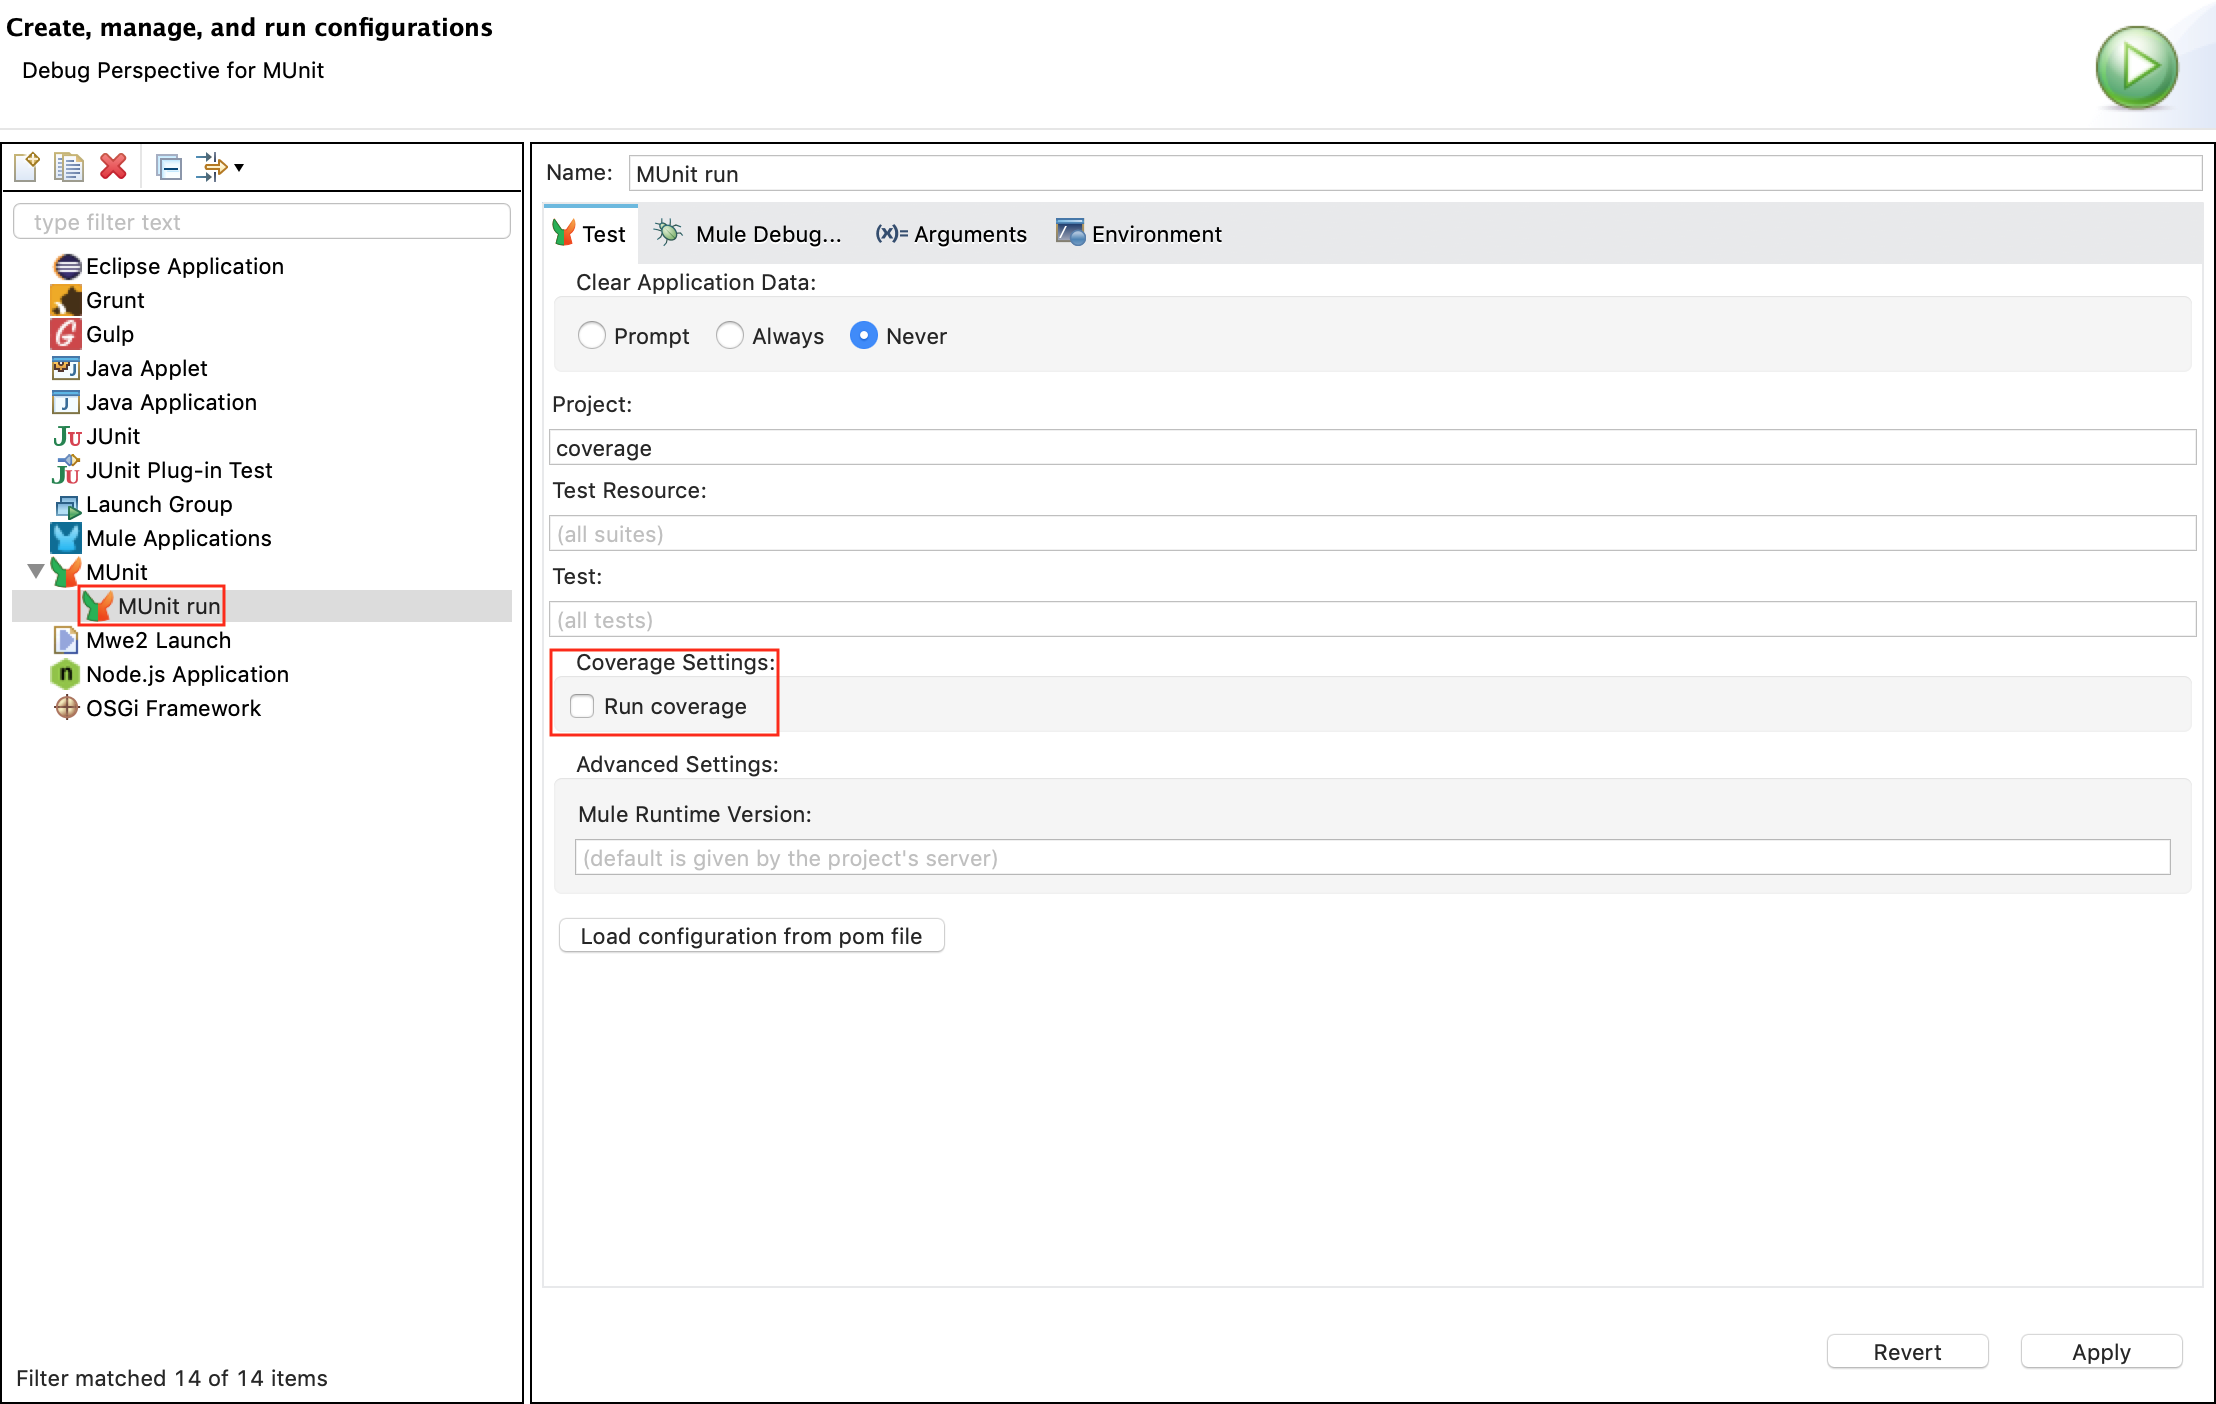
If you choose so, you can disable the coverage calculation from your project’s run configuration.
Right click in your Package Explorer, and choose Run As and Run Configurations…, select your MUnit run configuration file to access your suite’s configuration, and deselect the "Run coverage" option under your coverage settings.
