About Coverage Report (Studio)
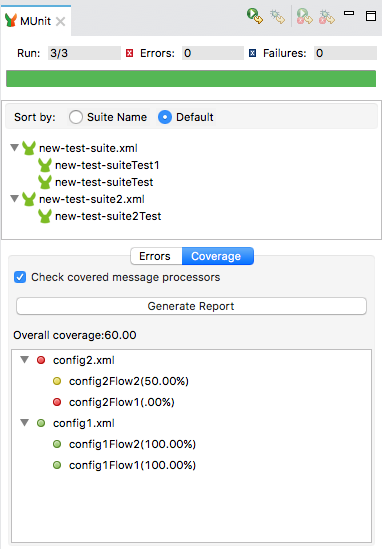
The Coverage button in the image above allows you to see which flows, and which percentage of event processors in those flows were covered by the test:

The Overall Coverage value represents the percentage of the Mule application event processors that have been executed by the MUnit test.
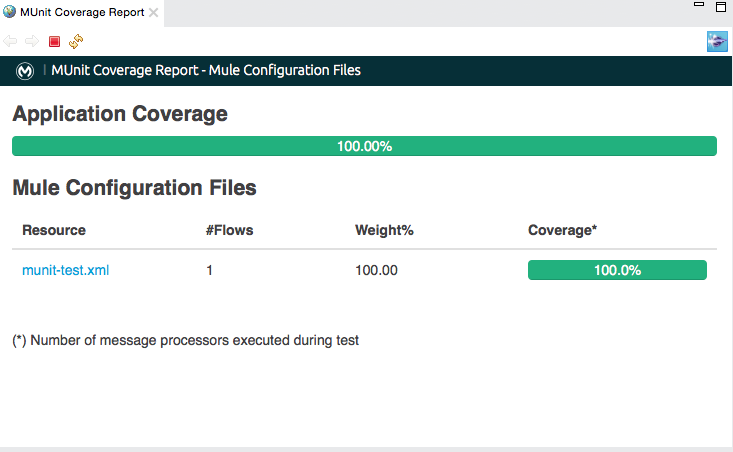
You can click the Generate Report button to get the report detailing the flows and event processors contained by the Mule configuration files that were included in the MUnit test.

| Column | Description |
|---|---|
Resource |
The name of the Mule Configuration file. |
Flows |
Number of Flows inside the Mule configuration field. |
Weight |
This field represents how much of your application is contained inside a configuration file. |
Coverage |
This field represents the percentage of the event processors inside the Mule Configuration file that are being executed in the MUnit test. |
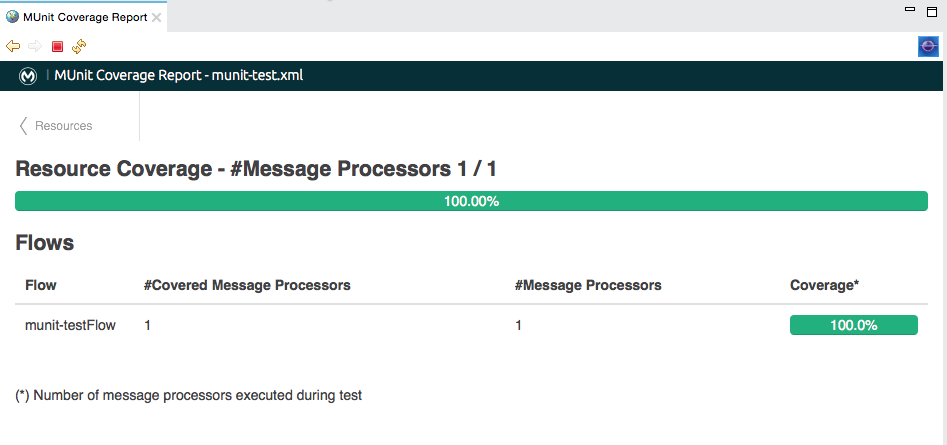
Additionally you can click in each Resource, to get a more specific and granular report of the Event Processors executed in that resource:


