
Using Anypoint Code Builder to Configure Tracing Module 1.3
Anypoint Code Builder (ACB) editors help you design and update your Mule applications, properties, and configuration files.
To add and configure a module in Anypoint Code Builder:
When you run the module, you can view the app log to check for problems, as described in View the App Log.
If, after reading this topic, you need additional information about the module fields, see the Tracing Module Reference.
Before You Begin
Before creating an integration project, you must:
-
Set up and access the Anypoint Code Builder web or desktop IDE
-
Have Anypoint Platform credentials
Create a New Integration Project
To create a new integration project:
-
In the activity bar of the IDE, click the
 (Anypoint Code Builder) icon.
 -
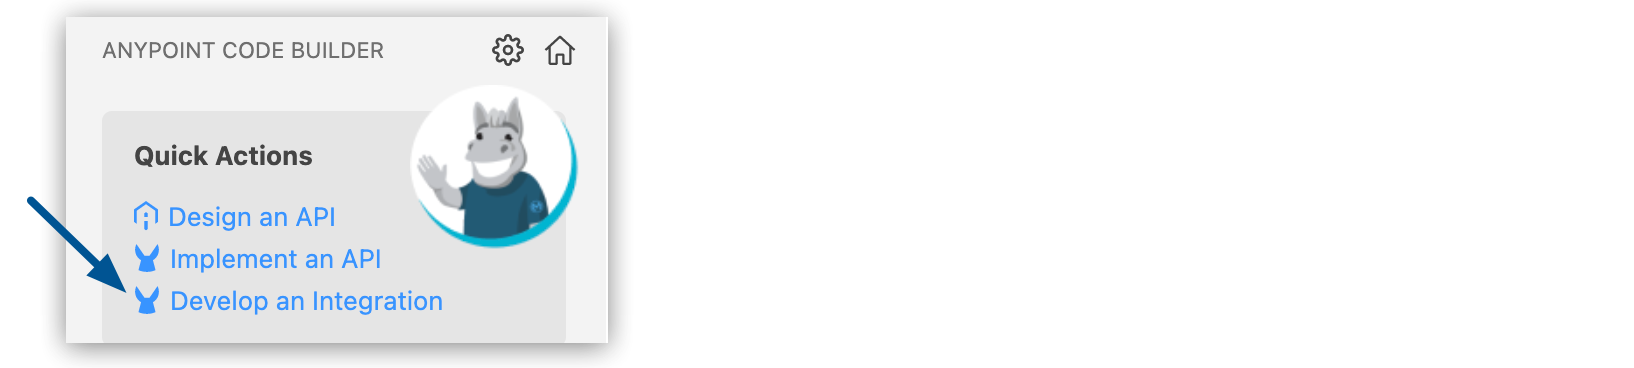
From Quick Actions, click Develop an Integration:
-
Complete the following in the Develop an Integration form:
Attribute Value Project Name
Unique name for your project.
This name is used as the title and name of the integration project file. For example, if the project name is "Salesforce Integration," the project file name is
salesforce-integration.Project Location
Your home directory or another directory you create. Click Browse to select a different directory for the integration project.
Don’t create the project within another project directory.
-
Select the type of project to create by selecting either the Empty Project or Template or Example card.
-
Select the Mule runtime and Java Version for your app.
-
Click Create Project.
Add the Module to Your Integration Project
Add Tracing module to your integration project to automatically populate the configuration XML file with the module’s namespace and schema location and to add the required dependency to the project’s pom.xml file:
-
In the Explorer view, open the configuration XML file for your project, such as
my-project-name.xml. -
Click the
 (Show Mule graphical mode) icon in the activity bar to open the canvas UI if it doesn’t open automatically.
 -
In the canvas UI, click the
 (Add component) icon.
 -
In the Add Component panel, click the
 (Search in Exchange) toggle and search for
 tracing. -
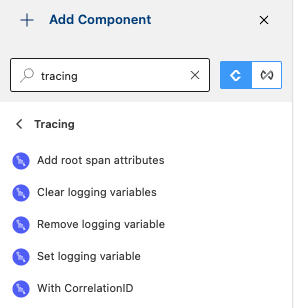
Click Tracing Module and then click the operation or scope to add.
Adding a module to an integration project does not make that module available to other projects in your Anypoint Code Builder workspace.
Configure a Source for the Flow
A trigger (source) starts the flow when specified conditions are met. If a connector has its own associated sources, you can use a connector-specific trigger to initiate the flow. Each connector trigger has a unique configuration.
You can configure the following sources for this connector:
-
HTTP > Listener
Initiates a flow each time it receives a request on the configured host and port
-
Scheduler
Initiates a flow when a time-based condition is met
For example, to configure an HTTP Listener trigger, follow these steps:
-
Click the Listener component on the canvas UI.
-
(Optional) Click the edit icon to change the name of the Listener component.
-
(Optional) If you created a configuration file for the connector, select it.
-
In the General tab, in the Path field, enter the relative path for the path set in the HTTP configuration element. See Configure Paths.
-
Select the Advanced tab to configure the following attributes:
Attribute Description Required Allowed methods
To allow all HTTP methods (default), do not define this attribute. To restrict certain methods, specify all allowed HTTP methods, for example,
GET, POST, as a comma-separated list.No
Response streaming mode
Whether to use streaming when the response is sent.
No
Output MIME type
MIME type of the payload that this component outputs.
No
Parameters
Appends a key-value pair for a reader property to the value of the Output MIME attribute. Multiple key-value pairs are allowed.
No
Output encoding
Encoding of the payload that this component outputs.
No
Streaming Strategy
Configures the way data streams are consumed in Mule apps.
No
Primary node only
Select this option to execute the Listener trigger on the primary node only when running in a cluster.
No
Redelivery policy
Configures the redelivery policy for executing requests that generate errors. You can add a redelivery policy to any source in a flow.
No
Reconnection strategy
When an operation in a Mule application fails to connect to an external server, the default behavior is for the operation to fail immediately and return a connectivity error. You can modify the default behavior by configuring the reconnection strategy for the operation.
No
Response
No
Error Response
HTTP error response returns a status code for the error.
No
Body
Body of the error message.
No
Headers
Headers to include in the error message.
No
Status code
Status code of the error response, for example,
500.No
Reason phrase
Reason for the error, for example,
Gateway TimeoutorInternal Server Error.No
Add a Global Configuration
Add another component, this time using the XML configuration menu. For example, add the <http:listener-config/> component from a snippet.
For more information about snippets, see Configuring Components.
-
In the configuration XML, place your cursor before the
<flow/>element and typehttp.Ensure that the cursor is not inside the
<flow/>element. -
Type
http, and select thehttp:listener-configsnippet: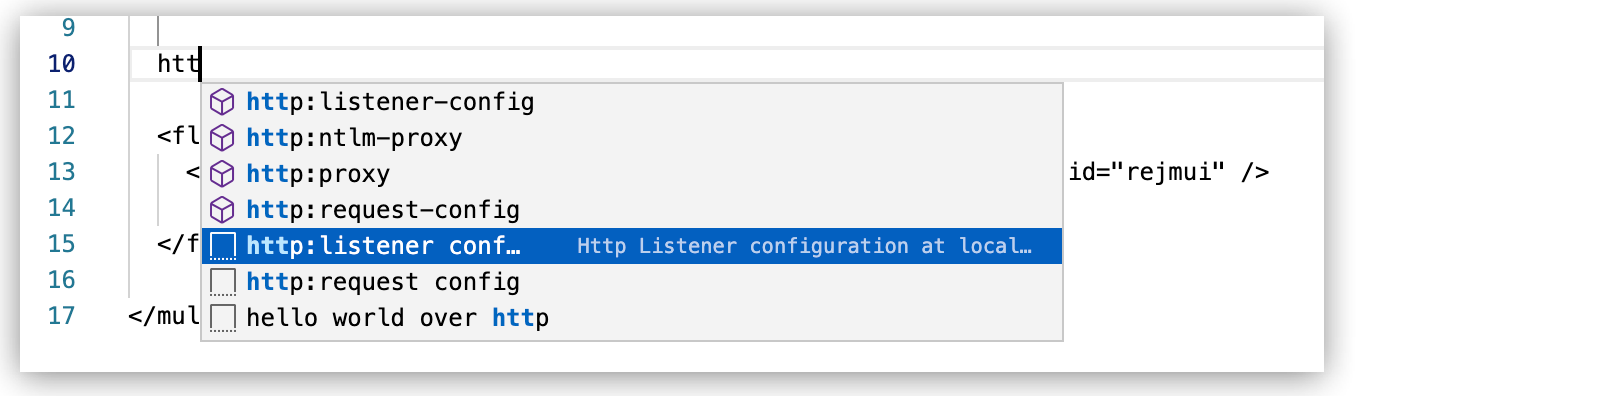
The snippet adds the following code:
<http:listener-config name="HTTP_Listener_config" >
  <http:listener-connection host="0.0.0.0" port="8081" />
</http:listener-config>
Add a Module Operation or Scope to the Flow
When you add a module operation or scope to your flow, you immediately define a specific operation for that module to perform.
After you add components to your integration project, configure the attributes in the component UI, or configure the attributes directly in the XML code editor.
Connector XML tags start with a namespace followed by an operation, following the syntax namespace:operation, such as <db:select/> for a Select operation in Anypoint Connector for Database (Database Connector).
You can use autocomplete from an expression (fx) field for a component to select DataWeave functions from the Core module and other values accepted in this field.
Run Your Application
-
Open the Run and Debug panel.
Show me how
-
Click the
 (Run and Debug) icon in the activity bar.
 -
Use the keyboard shortcuts:
-
Mac: Cmd+Shift+d
-
Windows: Ctrl+Shift+d
-
-
Select View > Run.
-
-
Click the
 (Start Debugging (F5)) icon for Debug Mule Application.
Alternatively, if the Start Debugging (F5) icon is not present:
-
Click Run and Debug.
-
If a Select debugger dropdown menu appears, select Mule Xml Debugger to initiate the debugging session:

When the application deploys successfully, you see a
DEPLOYEDlog message in the output panel:********************************************************************** * - - + DOMAIN + - - * - - + STATUS + - - * ********************************************************************** * default * DEPLOYED * **********************************************************************
-
View the App Log
To check for problems, you can view the app log in the Output panel of Anypoint Code Builder.
Unless the log file path is customized in the app’s log file (log4j2.xml), you can also view the app log in the default location MULE_HOME/logs/<app-name>.log.