Debugging Mule Applications
 Cloud IDE
 Desktop IDE
In Anypoint Code Builder, the embedded debugger pauses Mule flows so you can inspect payloads and variables, evaluate DataWeave expressions, and step through processors in the XML editor or on the canvas. Set breakpoints in configuration files or on components, run in debug mode, step through execution with the debug toolbar, and hot deploy updates while the runtime stays up. The result is faster diagnosis: you confirm event state and processor behavior before you ship your integration.
Complete these steps:
-
Set breakpoints to pause the execution of a flow at lines that you want to inspect or fix.
Breakpoints are markers that you add on line numbers in a configuration XML file for a Mule application that you are developing.
-
Start execution of a flow in your Mule application.
For example, trigger an HTTP Listener or configure a Scheduler component.
-
When the execution stops at a breakpoint, use the debug toolbar to navigate, inspect, and fix issues.
-
After addressing an issue at a breakpoint, redeploy (hot deploy) the running instance of your application.
-
Execute your flow again, and continue debugging until you address all issues.
Debugger View Overview
Use Run and Debug to open the view. Start a Mule debug session (Start Debugging, F5), inspect runtime state, and manage breakpoints. Keyboard shortcut to open the view: Cmd+Shift+D (Mac) or Ctrl+Shift+D (Windows).
The Debug Console tab in the lower panel area lets you evaluate DataWeave while execution is paused. See Evaluate DataWeave While Debugging.
Panels and Tools
-
Debug toolbar — Appears when a session is active. See Debug Toolbar for Continue, Step Over, Step Into, Step Out, Restart, and Stop.
-
Variables — Tree of the current Mule event: payload, attributes, variables, and component parameters (such as the current processor name). See Inspect Variables and the Mule Event for how errors, MIME types, copying, and editing appear in this release.
-
Watch — Pin DataWeave expressions that reevaluate whenever execution pauses.
-
Call Stack — Frames for the current execution context (including multiple threads when applicable).
-
Breakpoints — Breakpoints listed by file and line, including All Exceptions when you want to stop on any thrown exception.
-
Terminal — Maven build output and deployment messages for the embedded Mule runtime.
Breakpoints appear in the XML editor and on canvas processors. For more information about adding breakpoints from the editor or the canvas, see Add a Breakpoint.
Canvas Behavior While Debugging
When execution pauses at a breakpoint or after a step, the flow canvas shows which processor is active. The paused processor is outlined so you can see where the runtime stopped. The canvas view scrolls as needed to keep that processor in view when a pause occurs so you can follow execution without searching the diagram manually.
Source Editor and Multiple Configuration Files
Projects can split flows across several Mule configuration XML files. When a breakpoint is hit or you step, the editor opens or switches focus to the XML file that contains the flow and processor that is actually executing, and the canvas shows that configuration. Stepping through a <flow-ref> into a referenced flow opens the file that declares that referenced flow and updates the canvas accordingly.
Inspect Variables and the Mule Event
While execution is paused, use the Variables tree to inspect payload, attributes, vars, and related values.
When the Mule event has an error in scope, the Variables view includes error information so you can diagnose failures without hunting through unrelated nodes. When no error is present, that error-specific presentation is omitted.
Payloads and values that use common text-based MIME types (such as application/json, text/xml, and text/plain) appear as readable text in the tree. Values that are truly binary are shown with a compact placeholder instead of a long byte dump.
To reuse a value elsewhere, copy it from the tree using the context menu action that copies the value as JSON. Copied JSON is valid for typical parsers. The string escaping matches what you paste into external tools.
Change some variable values during a pause. Use the variable context menu to edit the value inline where the debugger allows it. After resuming, the running application uses the updated value.
Add a Breakpoint
A breakpoint enables you to pause your Mule application at a specific place to learn more about what is happening. You can either add a breakpoint to a configuration XML file or to a component in the canvas UI.
Add a Breakpoint in a Configuration File
To add a breakpoint in a configuration XML file:
-
In Anypoint Code Builder, on the Explorer view, open your configuration XML file, for example,
my-project-name.xml. -
Open the Run and Debug panel.
Show me how
-
Click the
 (Run and Debug) icon in the activity bar.
 -
Use the keyboard shortcuts:
-
Mac: Cmd+Shift+d
-
Windows: Ctrl+Shift+d
-
-
In the desktop IDE, select View > Run.
-
In the cloud IDE, click the
 (menu) icon, and select View > Run.
-
-
In the XML editor, click the gutter beside the line number for the component where you want the execution to pause.
The gutter shows a breakpoint indicator for that line. You can also move the caret to the line and press F9 to toggle a breakpoint.
-
Add more breakpoints on other lines as needed.
Registered breakpoints appear in the Run and Debug view under Breakpoints, grouped by file and line, with checkboxes to enable or disable each one.
Add a Breakpoint to a Component in the Canvas UI
To add a breakpoint to a component in the canvas UI:
-
In Anypoint Code Builder, on the Explorer view, open your configuration XML file, for example,
flights-implementation.xml. -
Open the Run and Debug panel.
Show me how
-
Click the
(Run and Debug) icon in the activity bar. -
Use the keyboard shortcuts:
-
Mac: Cmd+Shift+d
-
Windows: Ctrl+Shift+d
-
-
In the desktop IDE, select View > Run.
-
In the cloud IDE, click the
(menu) icon, and select View > Run.
-
-
In the canvas, right-click the processor where you want to pause and choose Add Breakpoint.
A breakpoint indicator appears on that processor in the canvas and at the corresponding line in the configuration XML.
Add a Breakpoint to a Batch Component
Add a breakpoint to a batch component in the canvas UI or in a configuration XML file:
-
In Anypoint Code Builder, on the Explorer view, open your configuration XML file, for example,
batch-example.xml. -
Open the Run and Debug panel.
Show me how
-
Click the
(Run and Debug) icon in the activity bar. -
Use the keyboard shortcuts:
-
Mac: Cmd+Shift+d
-
Windows: Ctrl+Shift+d
-
-
In the desktop IDE, select View > Run.
-
In the cloud IDE, click the
(menu) icon, and select View > Run.
-
-
In the canvas UI or code editor, select the batch component where you want to pause execution.
You can add breakpoints to these components: * Batch Job (
<batch:job/>) * Batch Step (<batch:step/>) * Batch Aggregator (<batch:aggregator/>) -
Right-click the component in the canvas UI and select Add Breakpoint, or click the line number in the code editor.
A breakpoint icon appears on the component and in the code editor for that component.
-
Run the application in debug mode.
When execution reaches the breakpoint, processing pauses so you can inspect variables, payloads, and the execution state in the Debug panel.
| Batch execution is concurrent. Multiple record blocks can be processed in parallel, so breakpoints can trigger on different threads. The Debug panel displays each thread context so you can inspect each execution path. |
Set a Conditional Breakpoint
A conditional breakpoint uses a DataWeave expression, so execution pauses at that line only when the expression evaluates to true.
To set or change a breakpoint condition:
-
Add a breakpoint in the code editor. See Add a Breakpoint.
-
Right-click the breakpoint indicator in the gutter for that line.
-
Select Edit Breakpoint.
-
In the breakpoint editor, enter a DataWeave expression that uses the current Mule event.
The gutter context menu for a breakpoint also includes Remove Breakpoint, Disable Breakpoint, and Run to Line.
To review a condition later, hover over the breakpoint in the gutter. A tooltip shows the configured expression in the form Condition: followed by your DataWeave expression.
Stop When an Exception Is Thrown
You can configure the debugger to pause whenever any exception is thrown, which helps you inspect failures without adding breakpoints to every path.
-
Open Run and Debug.
-
In the BREAKPOINTS section, enable All Exceptions.
When All Exceptions is enabled, the debugger pauses as soon as an exception is thrown during a debug session. The error type and a readable message are surfaced in the Variables area so you can see what failed without expanding deep trees first. Use Inspect Variables and the Mule Event together with Canvas Behavior While Debugging to relate the exception to the processor on the canvas.
Run Your Application in Debug Mode
After setting up your debug conditions, run a debug session and evaluate your Mule application at each breakpoint:
-
Open the Run and Debug panel.
Show me how
-
Click the
(Run and Debug) icon in the activity bar. -
Use the keyboard shortcuts:
-
Mac: Cmd+Shift+d
-
Windows: Ctrl+Shift+d
-
-
In the desktop IDE, select View > Run.
-
In the cloud IDE, click the
(menu) icon, and select View > Run.
-
-
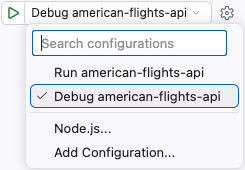
In the Run Configurations dropdown menu, select Debug {your-project-name}.
-
Click the
 (Start Debugging (F5)) icon for Debug Mule Application.
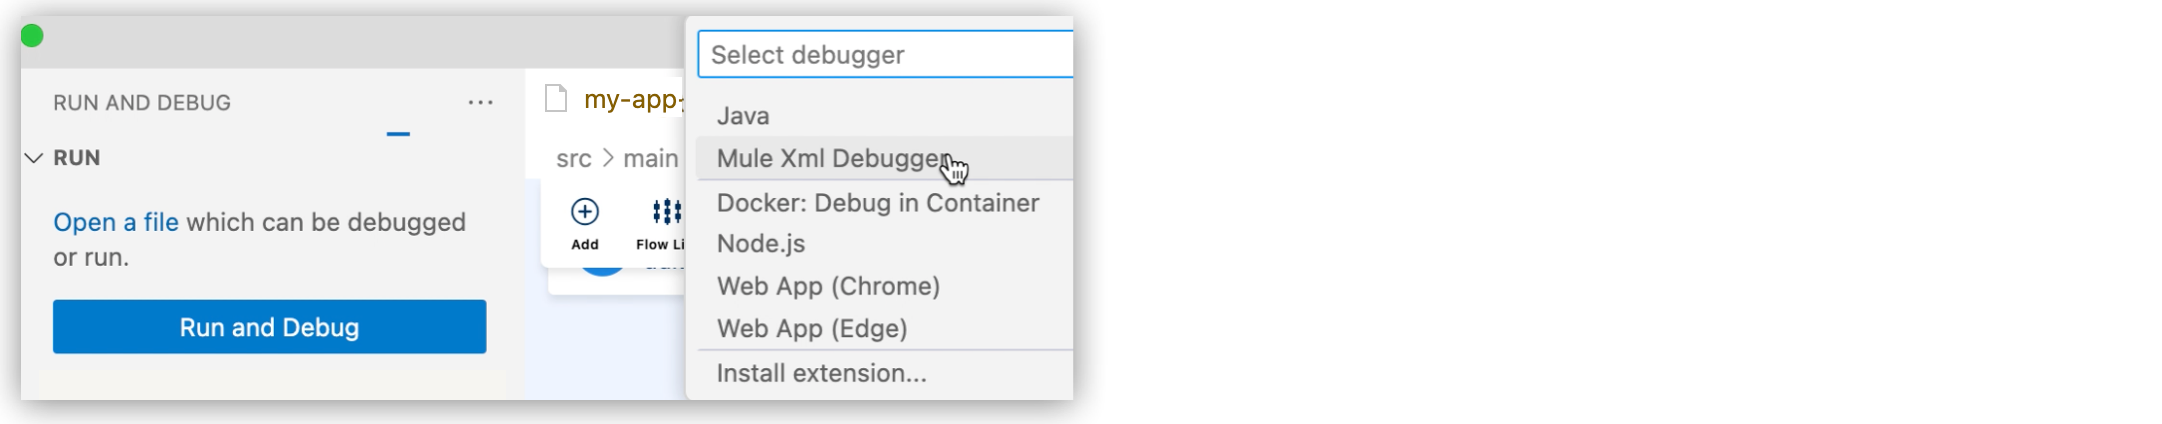
Alternatively, if the Start Debugging (F5) icon is not present:
-
Click Run and Debug.
-
If a Select debugger dropdown menu appears, select Mule Xml Debugger to initiate the debugging session:
When the application deploys successfully, you see a
DEPLOYEDlog message in the output panel:********************************************************************** * - - + DOMAIN + - - * - - + STATUS + - - * ********************************************************************** * default * DEPLOYED * **********************************************************************
-
| Selecting Run > Start without Debugging produces an error. |
Anypoint Code Builder packages your application and deploys the application to the embedded Mule runtime engine. The integrated terminal shows Maven and deployment progress, and the status bar indicates that the application is running.
Use the controls on the debug toolbar to drive the session after you trigger your flow.
Debug Toolbar
When a Mule debug session is active, the debug toolbar provides:
-
Continue (F5) — Runs until the next breakpoint or the end of the application.
-
Step Over (F10) — Runs to the next processor in the current flow and pauses there.
At a Flow Ref component (
<flow-ref/>), Step Over doesn’t enter the referenced flow. It moves to the next processor after the reference in the same flow instead.Step Over Details
Configuration XML example:
<flow name="flow1" doc:name="Flow" >
  <http:listener path="greet" config-ref="HTTP_Listener_config" doc:name="Listener"/>
  <flow-ref name="myNewFlow" /> (1)
  <logger doc:name="Logger1" message="test1"/> (2)
</flow>

<flow name="myNewFlow" doc:name="Flow" >
  <logger doc:name="Logger2" message="test2"/>
</flow>
Step Over behavior:
1 Skips <flow-ref/>logic2 Reaches <logger/>namedLogger1 -
Step Into (F11) — Enters the next processor, including following a
<flow-ref/>into the referenced flow.When you step into a flow reference, the IDE opens the Mule configuration file that declares that referenced flow, moves the canvas to that flow, and pauses on the first processor inside it. After you step through the referenced flow, stepping continues in the caller flow where appropriate.
Step Into Details
Configuration XML example:
<flow name="flow1" doc:name="Flow" >
  <http:listener path="greet" config-ref="HTTP_Listener_config" doc:name="Listener"/>
  <flow-ref name="myNewFlow" /> (1)
  <logger doc:name="Logger1" message="test1"/> (3)
</flow>

<flow name="myNewFlow" doc:name="Flow" >
  <logger doc:name="Logger2" message="test2"/> (2)
</flow>
Step Into behavior:
1 Enters <flow-ref/>to follow logic tomyNewFlow2 Reaches Logger2in next flow,myNewFlow3 Returns to flow flow1to reachLogger1 -
Step Out (Shift+F11) — Leaves the current flow and returns toward the caller when possible; if there is no caller frame, behaves like Continue.
-
Restart (Shift+Cmd+F5 on Mac, Shift+Ctrl+F5 on Windows) — Stops and restarts without picking up new Maven dependencies from
pom.xml. -
Stop (Shift+F5) — Ends the application. The next debug session repackages the app if you added connector or dependency changes.
Evaluate DataWeave While Debugging
While execution is paused, you can run DataWeave against the current Mule event from the Debug Console or from pinned entries in the Watch panel. For the variables available in those expressions, see Predefined Mule event variables.
Use the Debug Console
-
Start a debug session and pause execution at a breakpoint or after a step. See Run Your Application in Debug Mode and Debug Toolbar.
-
Open the Debug Console tab, or choose View > Debug Console.
-
Ensure the input is set to Expression. Type a DataWeave expression and press Enter to evaluate it against the current message, attributes, variables, and other values visible to the debugger at the pause.
The console shows each expression you run and its evaluated result for the current pause.
Use the Debug Console for checking the steps as you debug through a flow.
Use the Watch Panel
-
Open the Watch panel in the Run and Debug sidebar.
-
Add an entry with + and enter a DataWeave expression.
Whenever execution pauses, the debugger reevaluates each watch expression and shows the result next to the expression, similar to the Debug Console.
Watch expressions typically persist for later debug sessions in the same workspace, so you can keep inspecting the same values across runs.
Use the Watch panel for values you want to track on every pause without retyping them.
Perform a Hot Deploy When Debugging
As you debug your application, periodically perform a hot deployment.
A hot deployment updates a running instance of your application but does not package new dependencies, such as new connector dependencies in your pom.xml.
To perform a hot deploy:
-
Ensure your Mule application is running in the IDE.
-
Make an update to your application.
-
In the editor toolbar for the running Mule application, click Save and Hot-deploy to Mule Runtime (lightning bolt icon) to push the change to the running runtime without a full stop and dependency resolution cycle.