Viewing Anypoint MQ Usage Data
Anypoint MQ uses API requests to calculate billing. Depending on your Anypoint Platform instance, you access usage data in Access Management or Usage.
- API requests
-
API requests are used to calculate your monthly quota for billing.
-
Every API call (via the connector or API) to Anypoint MQ counts as one API request.
All requests to the Anypoint MQ Broker API count against your monthly quota. Requests include sending, receiving, and acknowledging messages and operations on queues and exchanges.
Requests to the Anypoint MQ Stats API don’t count against your monthly usage.
-
You can retrieve up to 10 messages from a single API call, which only bills as one request.
Even if the request to retrieve messages does not return a message (for example, if the queue is empty), it bills as a single API request.
-
If a queue sends a message to a DLQ, the message is not charged against the billable API requests.
However, if a client sends a message directly to a DLQ, that request is charged.
-
|
Enabling failover for a queue can result in increased API requests because Anypoint MQ Connector periodically checks the fallback queue for messages to consume. For more information, see Configure the Frequency of Fallback Queue Checks. |
- Message units
-
Message units are not used for billing.
Message units are used by Anypoint MQ to determine the size of message data in the response.
-
Each message unit contains 100 KB of data.
-
Message units are counted by the number of encoded characters in a message.
-
If your usage exceeds your license limit, Anypoint MQ continues to work. MuleSoft notifies your account administrator and team with any billing-related information.
Access Anypoint MQ Usage Charts
| Only the US Cloud and EU Cloud instances of Anypoint Platform support this feature. |
To view Anypoint MQ usage charts in Access Management:
-
In Anypoint Platform, go to Access Management.
-
Click MQ in the Subscription section:
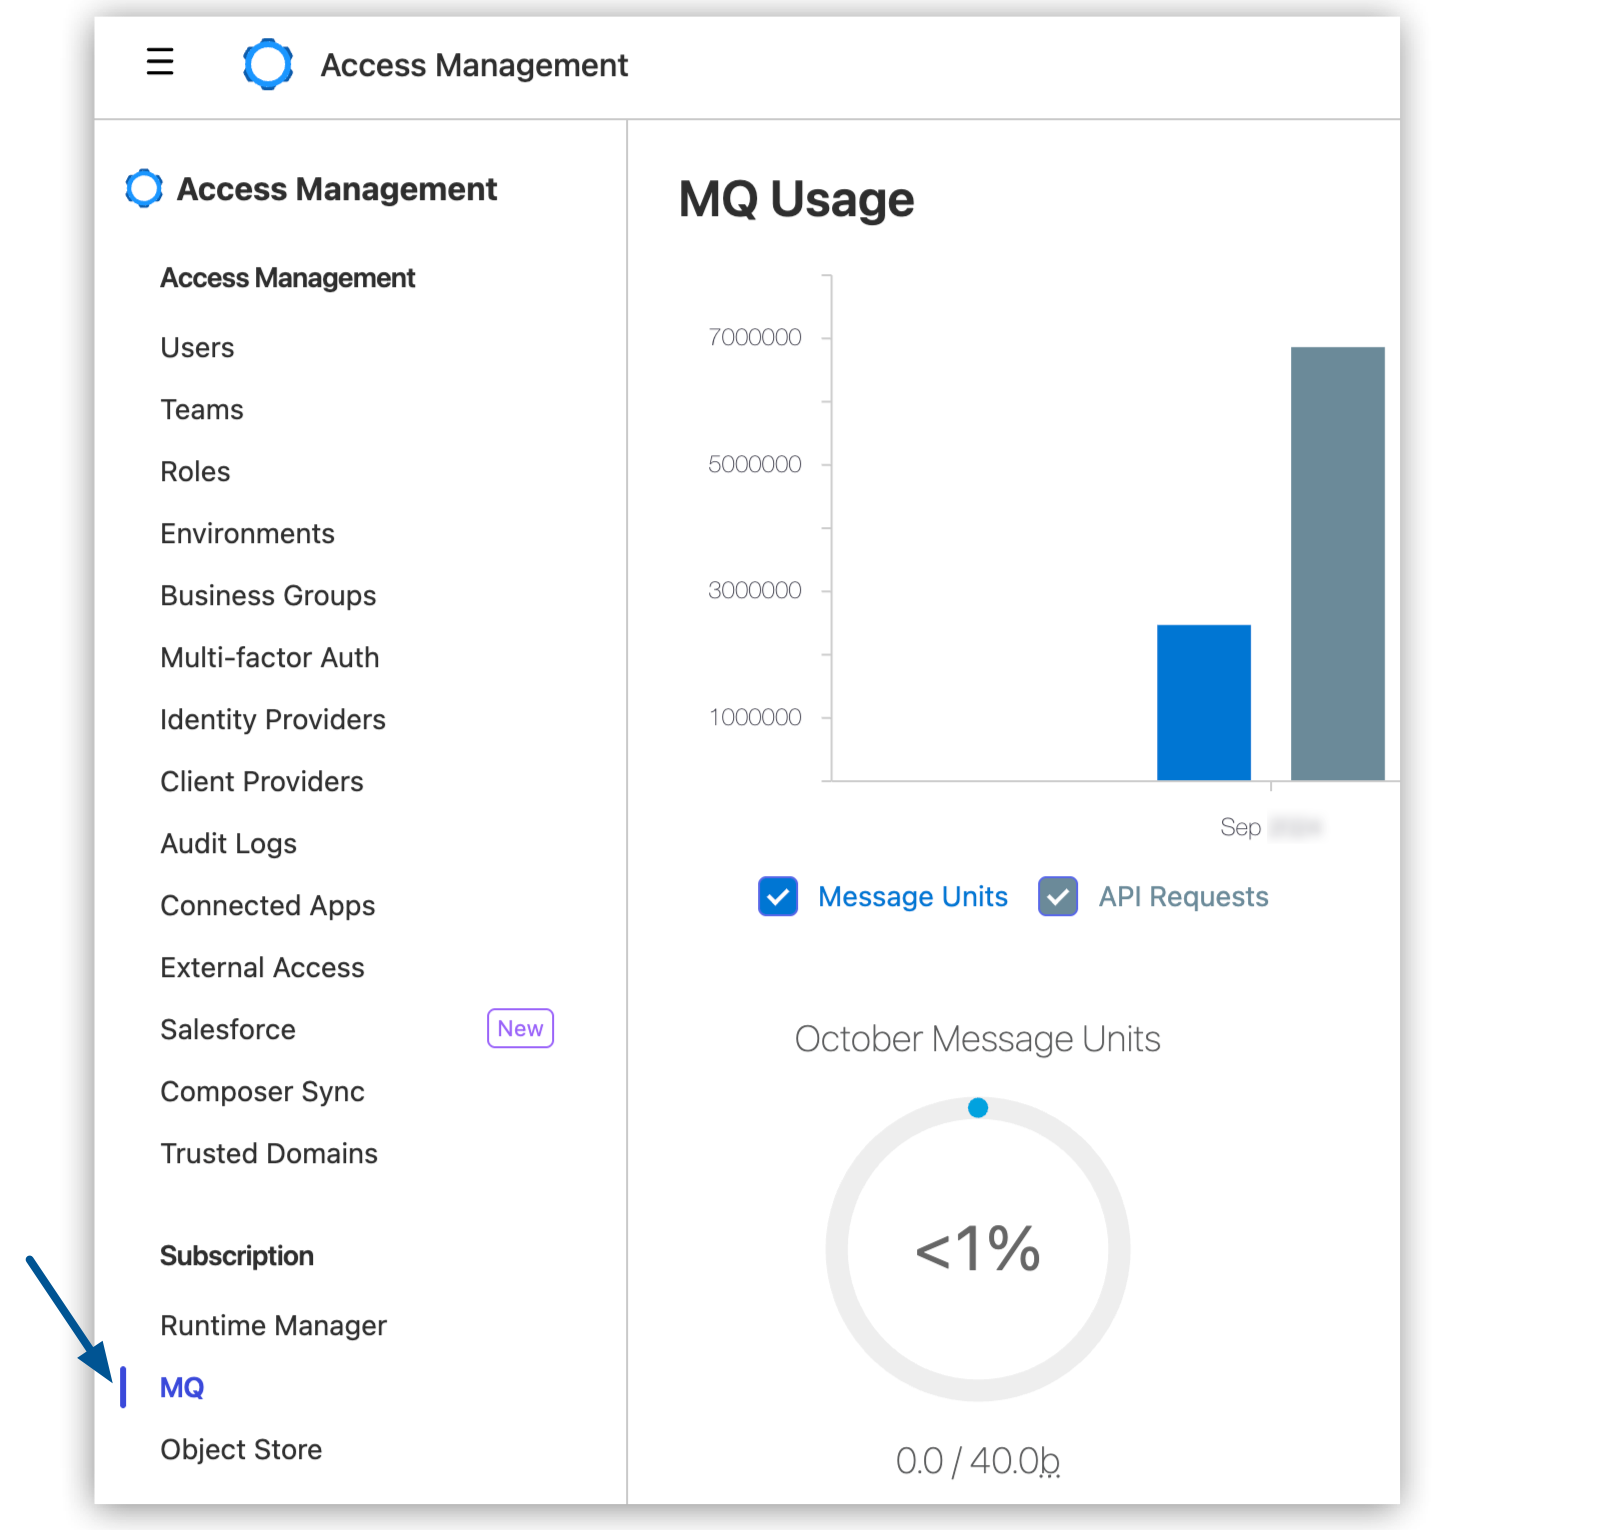
The chart shows usage stats for the current and previous month:
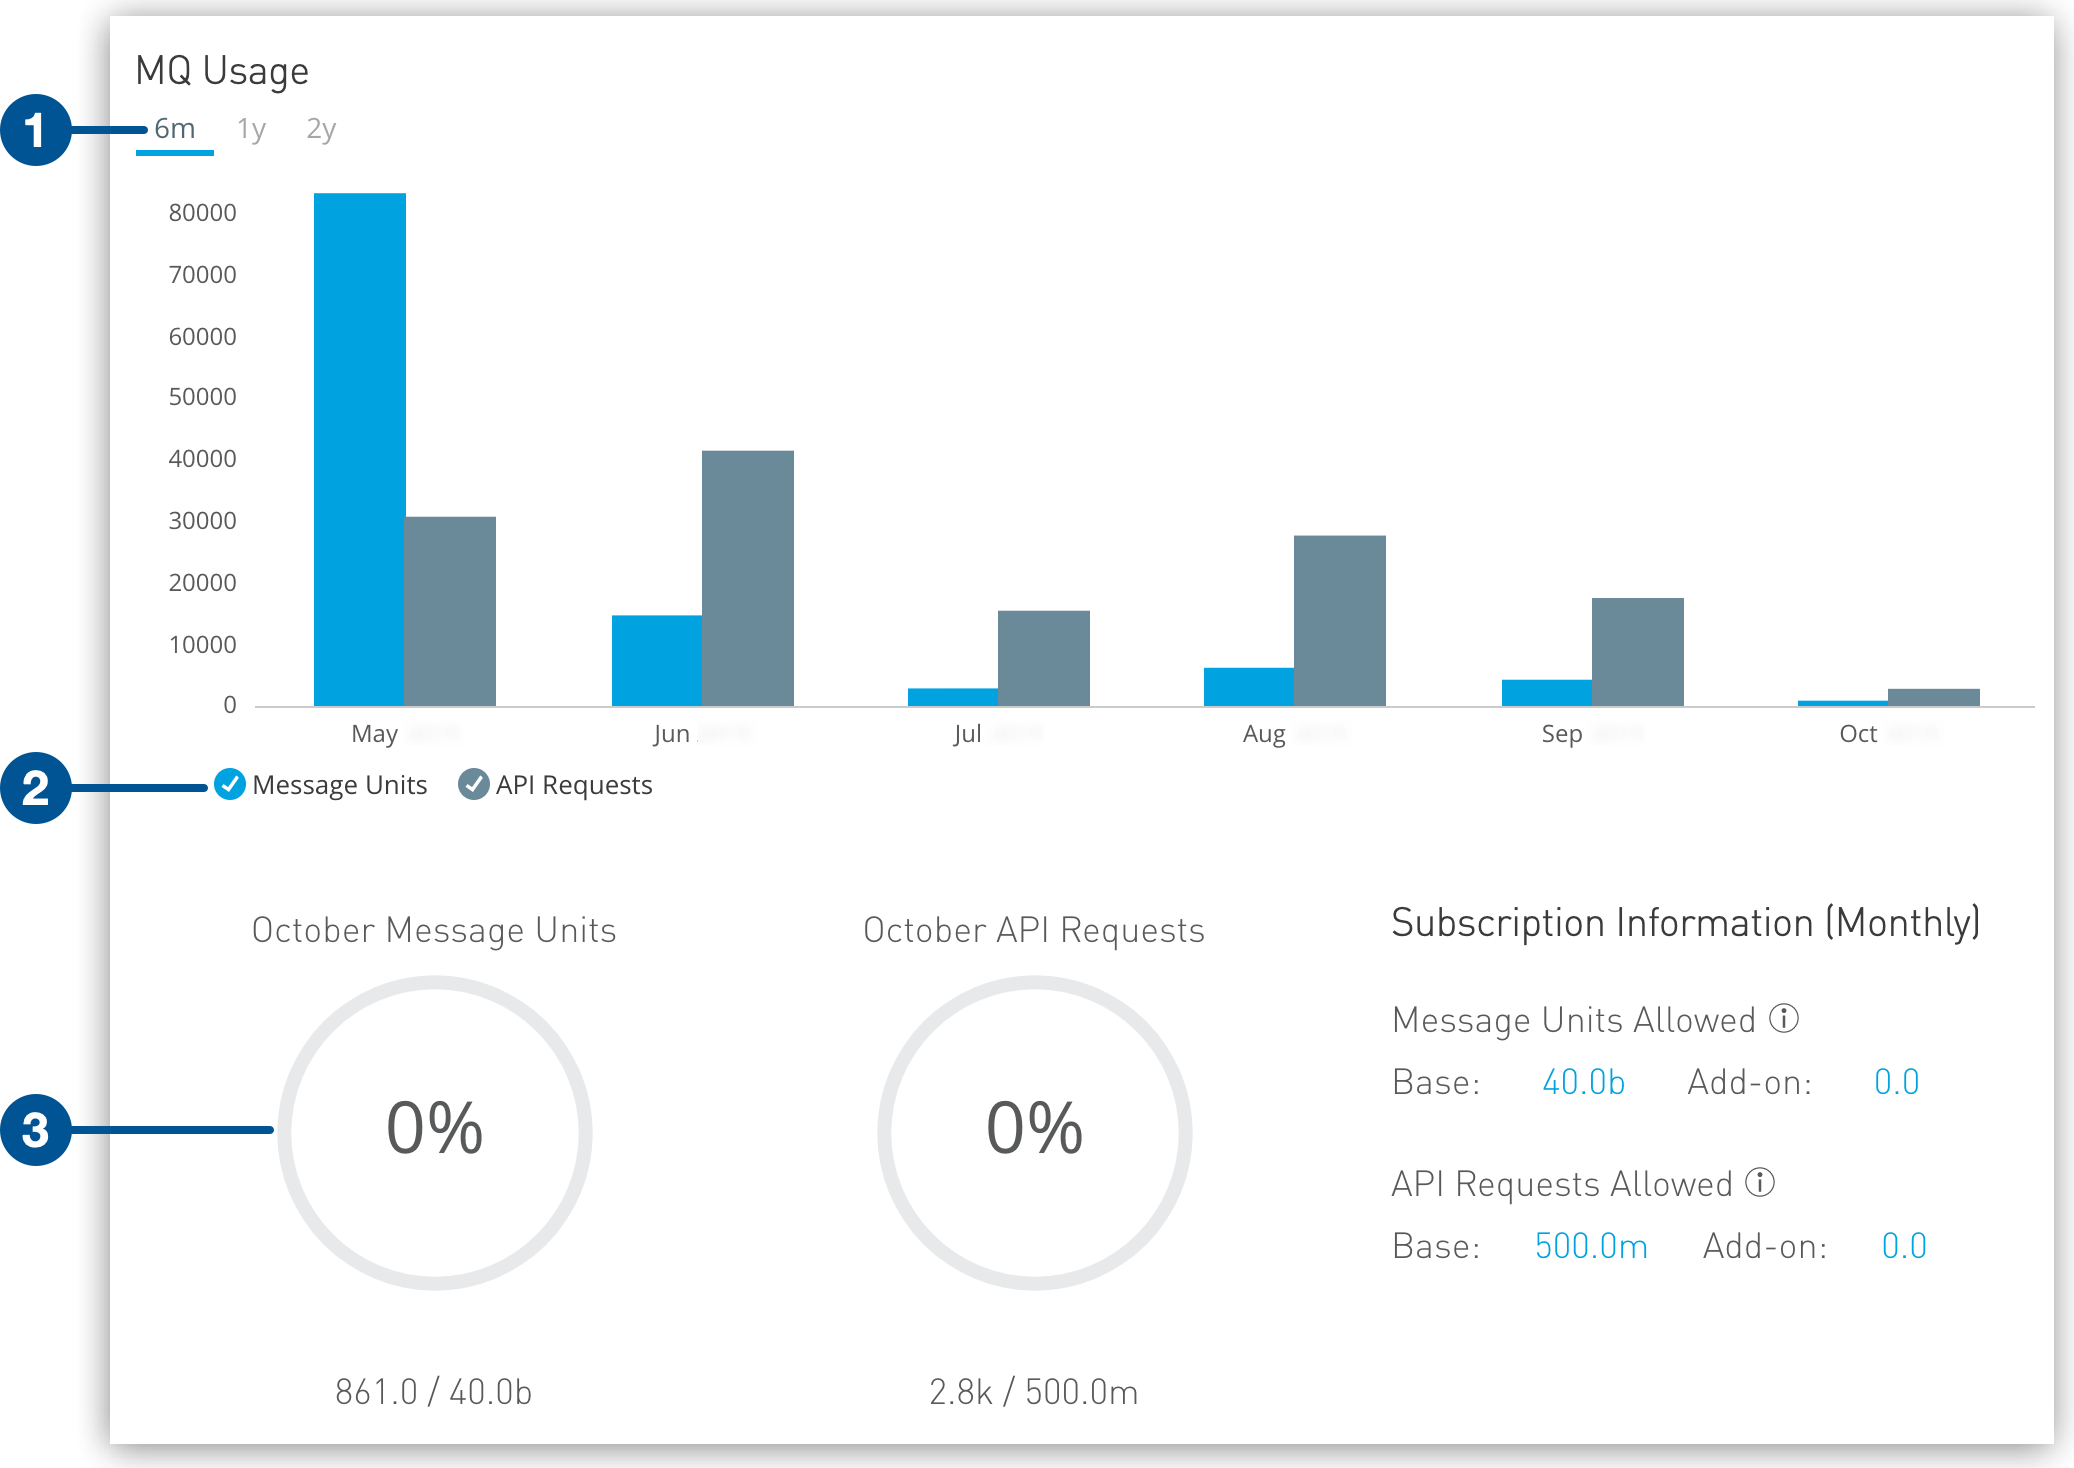
1 The percentage and amount used of your license limits. If the usage for either API requests or message units is 0, the chart displays
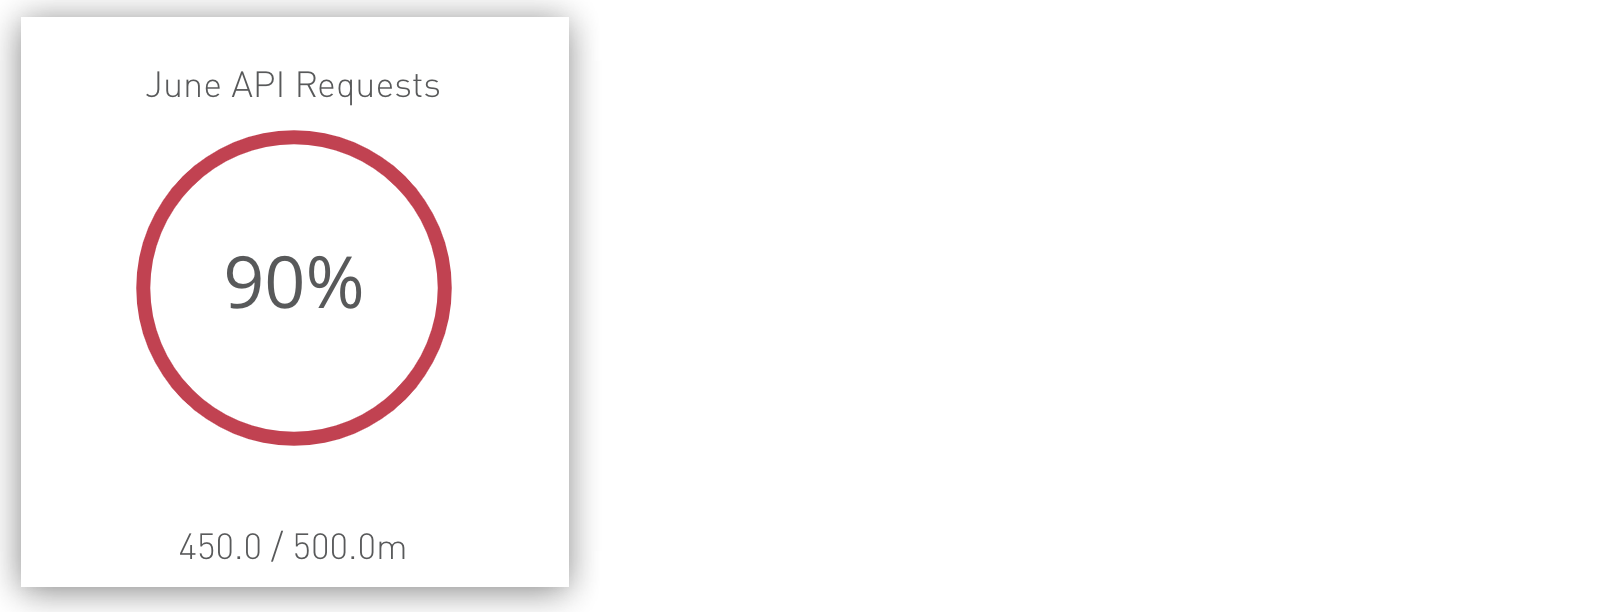
<1%.The circle graph changes to red as your usage approaches your license limits:
Monthly billing usage information might be delayed by up to 24 hours. 2 Subscription type Base 0.0indicates the Base subscription.Base values greater than
0.0indicate Premium add-on subscriptions.
In some cases, the stats for the current month might not load when the backend process updates the records. If this happens, use the Anypoint MQ Stats API Usage Metrics by Organization to query the daily usage in the current month and then add the daily usage together.
Access Anypoint MQ Usage Reports
| Only the Canada Cloud and Japan Cloud instances of Anypoint Platform support this feature. |
To view Anypoint MQ usage reports in Usage:
-
In Anypoint Platform, go to Usage.
-
Select Anypoint MQ in the Product section:

-
Select a month from the Monthly Usage Report tab or day from the Daily Usage Report tab.
The report shows usage for the selected period (total and by object):
-
Message units
-
Message bytes
-
API requests
-
Messages received
-
-
Click Export as CSV to download the usage for the selected period.
For more information, see Usage Reports.