Using MUnit in Anypoint Studio
The MUnit Folder
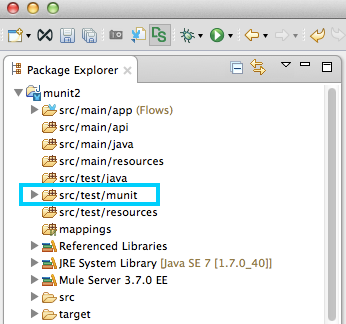
Using MUnit automatically adds a new folder, src/test/munit, to your project.
Creating a New MUnit Test in Studio
MUnit Studio integration is mainly built around XML-based tests. Most of the MUnit-Studio integration tools guide you in the creation of these tests.
There are two basic ways to create a new MUnit test in Studio:
-
Right-click a specific flow by right clicking the flow and selecting MUnit.
-
Use the wizard, which allows you to create a test for any flow or application in the workspace.
The most basic ones are by right-clicking the flow you want to test, or by using the wizard.
Creating a Test for a Specific Flow
To create a test for a specific flow, right-click the flow, then select MUnit > Create a new <flow_name> suite.
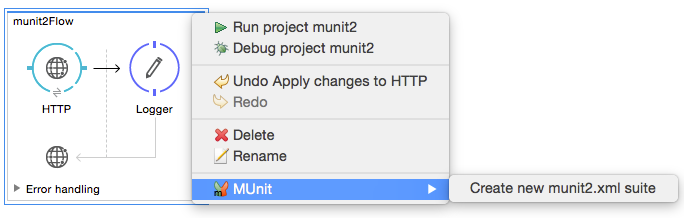
This action:
-
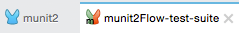
Creates a new test suite named after the XML file where the flow resides, in this case
munit2.xml. Studio displays the test suite on a new tab, next to the tab for the original application:
-
Imports the XML file to the test suite
-
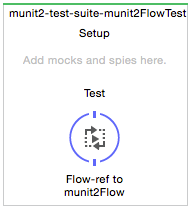
Creates a new MUnit test
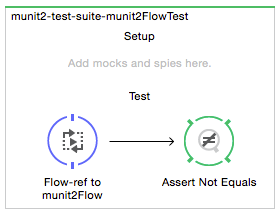
Below is the resulting MUnit test suite in Studio along with the XML file automatically generated for the new test suite:
Studio Visual Editor
XML or Standalone Editor
<?xml version="1.0" encoding="UTF-8"?>
<mule xmlns="http://www.mulesoft.org/schema/mule/core" xmlns:munit="http://www.mulesoft.org/schema/mule/munit" xmlns:doc="http://www.mulesoft.org/schema/mule/documentation" xmlns:spring="http://www.springframework.org/schema/beans" xmlns:core="http://www.mulesoft.org/schema/mule/core" xmlns:xsi="http://www.w3.org/2001/XMLSchema-instance" xsi:schemaLocation="http://www.mulesoft.org/schema/mule/munit http://www.mulesoft.org/schema/mule/munit/current/mule-munit.xsd
http://www.springframework.org/schema/beans http://www.springframework.org/schema/beans/spring-beans-current.xsd
http://www.mulesoft.org/schema/mule/core http://www.mulesoft.org/schema/mule/core/current/mule.xsd">
<munit:config name="munit" doc:name="MUnit configuration"/>
<spring:beans>
<spring:import resource="classpath:munit2.xml"/>
</spring:beans>
<munit:test name="munit2-test-suite-munit2FlowTest" description="Test">
<flow-ref name="munit2Flow" doc:name="Flow-ref to munit2Flow"/>
</munit:test>
</mule>xmlTo add an MUnit message processor to the test shown above, drag it from the Palette to the Test area after the flow-ref.
Creating a Test Via the Wizard
The wizard allows you to create a test for any flow or application in your Studio workspace.
To create a test via the wizard, go to File > New > MUnit Test. Studio displays the MUnit test creation wizard, shown below.
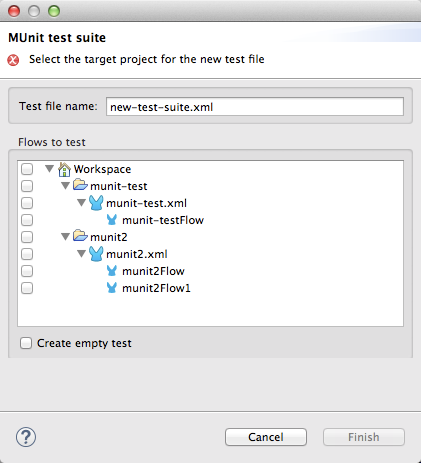
As you can see, the wizard allows you to select any of the flows and applications in the workspace.
If you want to create a test that does not reference a specific flow, click the Create empty test checkbox.
| You can also create a new test via the wizard by right-clicking the desired application in the Package Explorer pane, then selecting MUnit > Create new suite. |
|
Since version 1.2.0, MUnit supports testing for domain based applications. |
Configuring Your Test
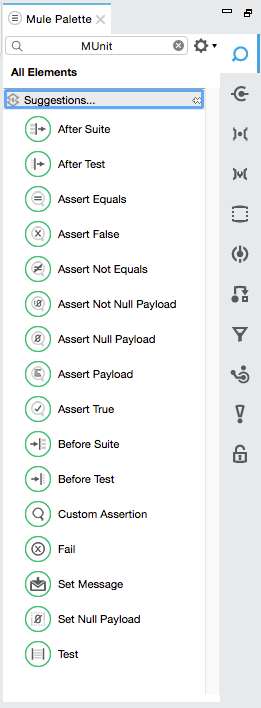
Studio displays the newly-created test suite in its own canvas. Here you can tailor your test suite using the Studio interface, just like a regular application. The Studio Palette displays two new sections: MUnit and MUnit Integration Test Tools. To quickly see all MUnit message processors, type munit in the Palette search filter.
You can edit run configurations for your suites/tests in Studio, just like any other run configuration. A run configuration must contain at least the project and the suite; additionally, you can specify a test if you want to run only that test.
To edit the configuration for your suit or test in Studio, follow these steps:
-
In the Package Explorer, right click the .xml file for your suite or test, then select Properties.
-
In the Properties window, click Run/Debug Settings, then click New.
-
In the Select Configuration Type window, click MUnit, then click OK.
The configuration window displays the three tabs for editing configuration properties: Test, Arguments and Environment, shown below:
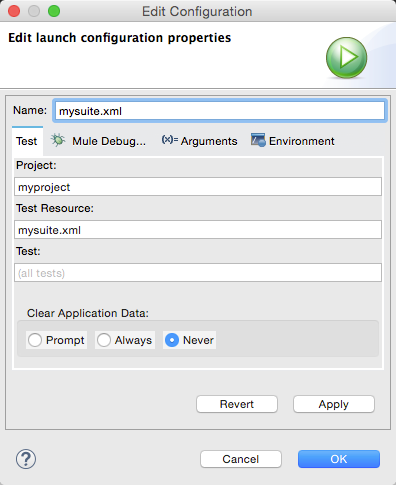
If the test name is blank, all tests in the given suite are run.
Adding JVM Arguments
To add JVM arguments, click the Arguments tab, then enter your arguments in the VM arguments input field. In the image below, java.library.path is being added as an argument.
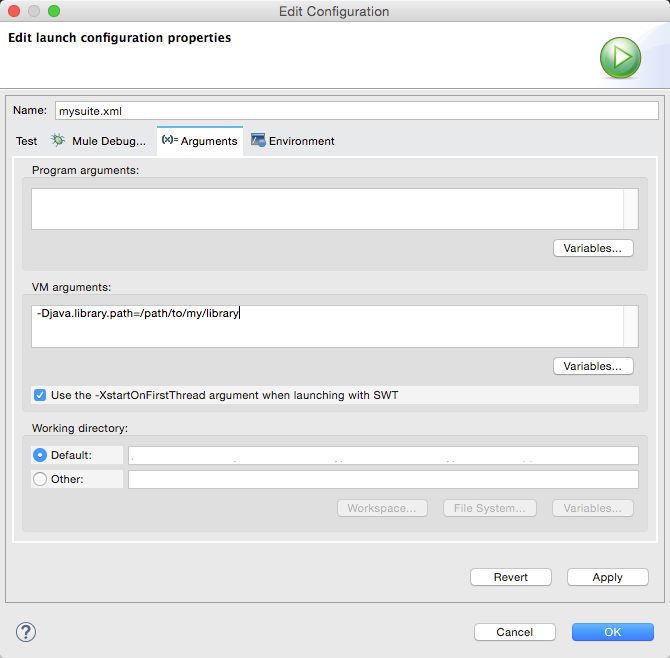
If your path contains a space followed by a dash, anything after the dash is parsed as a new JVM argument. For example, if the path is -Djava.library.path=/path/to/my -library, the -library is parsed as a new JVM argument and the run configuration does not work as expected. To include spaces in the path, use an escape character, such as %20: /path/to/my%20-library.
|
Environment Variables
Finally, you can also define environment variables. You can create your own variables and also use existing variables, such as HOME.
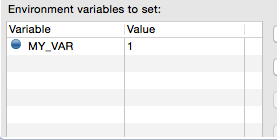
Environment variables override any property that is set in the mule-app.properties file, or by using a property placeholder.
In MUnit, you can load properties from the mule-app.properties file as well as using the context:property-placeholder to load properties from an additional file.
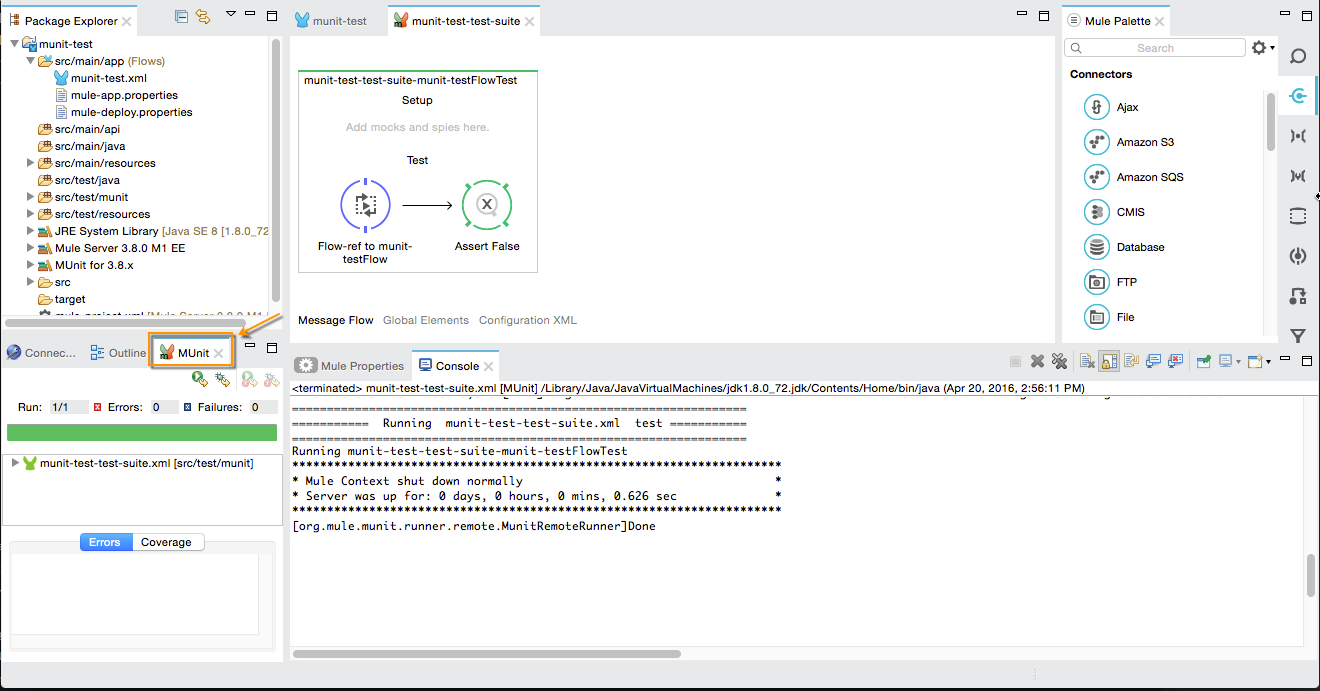
Running Your Test
Running a Test Suite
To run a test suite, right-click the empty canvas where the suite resides, then select Run MUnit suite.
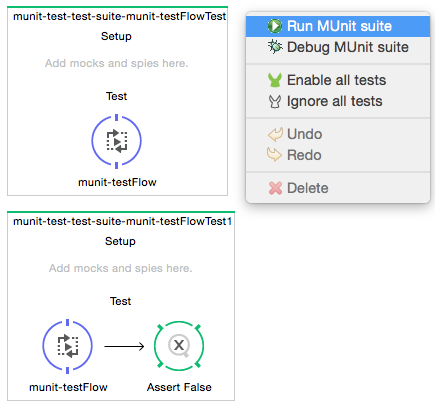
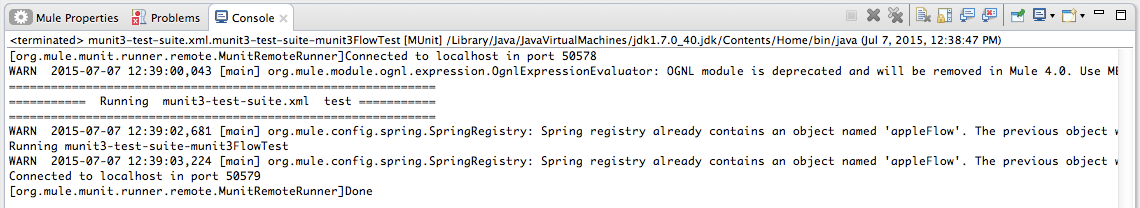
Studio displays the output from the running suite in the console.
Running a Test
To run a test, right-click the name of the test, then select Run MUnit Test.
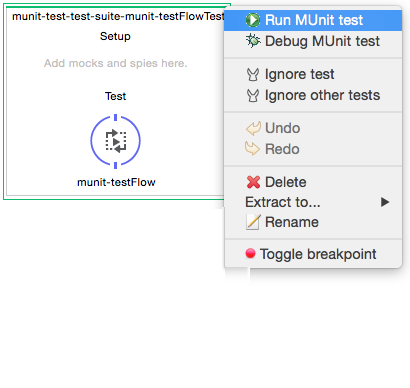
To check that the test is actually running, view the output in the console. In order not to overwhelm the user, the default output provides little information, but enough to verify that the test has run.
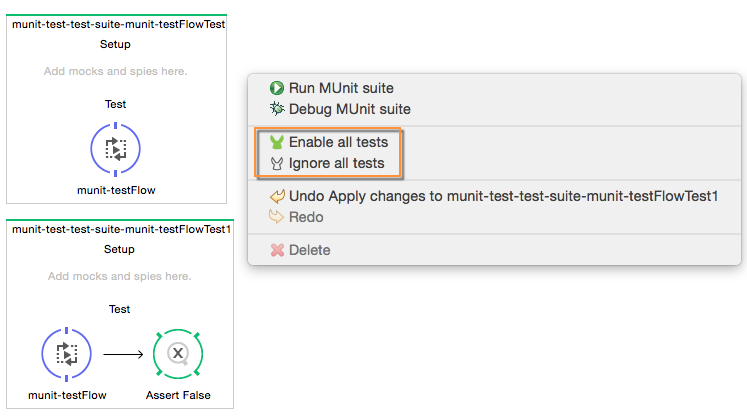
Additionally you can choose to disable or enable all tests in your MUnit suite
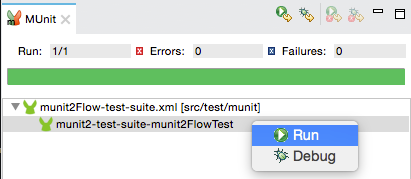
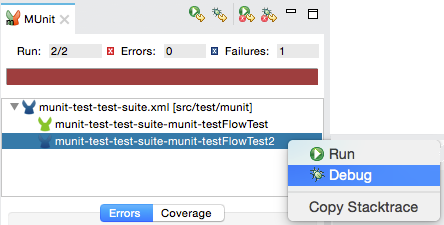
An alternative way to run a test is to use the MUnit tab (see below).
-
Select the desired test in the MUnit tab.
-
Right-click the test, then select Run.
| In the event you have failed tests, you can select the button run failed. This only runs tests that fail. |
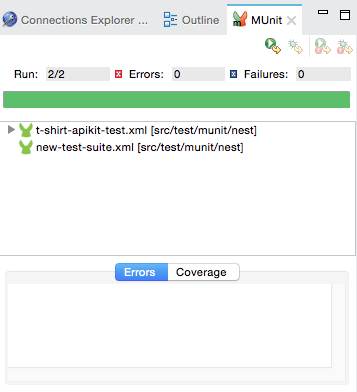
Running All Tests inside a Folder
To run all tests inside a specific folder in your Package Explorer, locate the folder, right click on it and select Run As, and MUnit.
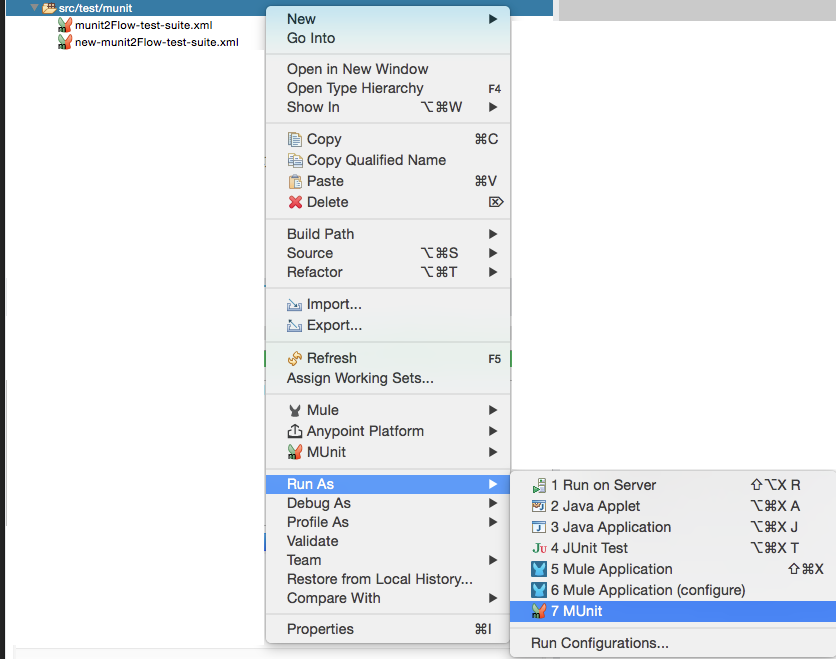
Both tests located in the folder run:
Viewing Test Results
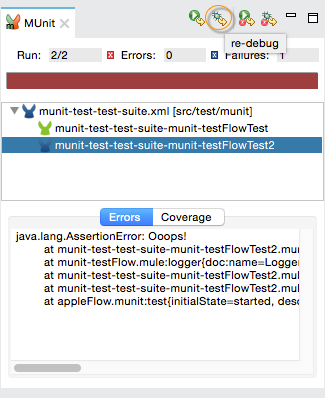
Studio displays MUnit test results in the MUnit tab of the left-hand explorer pane, outlined below:
| The layout of your views can change depending on how you configured your perspective. The picture shown above is for illustration purposes. |
The MUnit tab displays successful tests in green, failed tests in red.
If you run more than one test, the MUnit tab displays a history of run tests. For failed tests, the Errors button displays the stack trace, which you can copy to your clipboard. To copy the stack trace, right-click the name of the failed test, then select Copy Stack Trace.
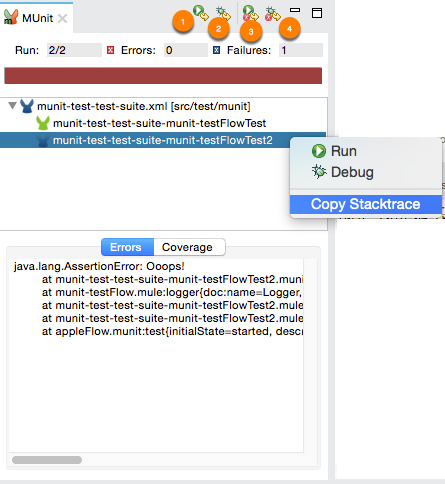
As you can see in the image above, you can also use the MUnit tab to Running Your Test or debug your test, by selecting the appropriate menu option.
Pay attention to the icons in the top right corner of your MUnit tab:
-
Click the re-run button to execute all tests that were run in the previous run
-
Click the re-debug button to debug all the tests that were debugged in the previous run
-
Click the re-run failed button to rerun only the tests that failed in the previous run
-
Click the re-debug failed button to debug all the tests that failed in the previous run
Viewing Coverage Reports
You can run coverage reports in Studio.
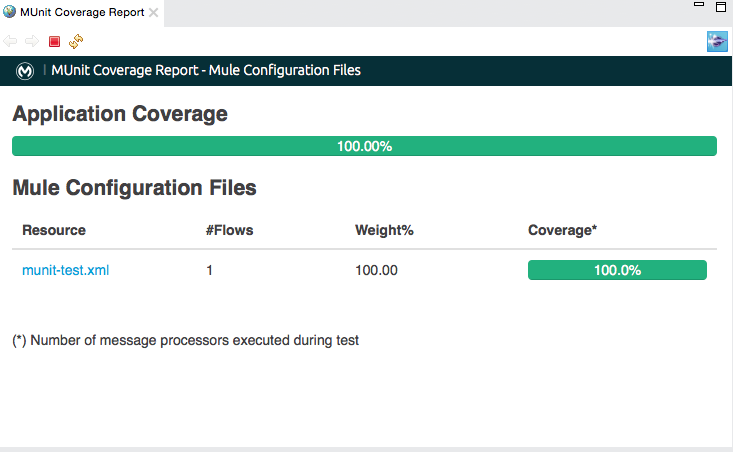
The Coverage button in the image above allows you to see which flows, and which percentage of message processors in those flows were covered by the test:
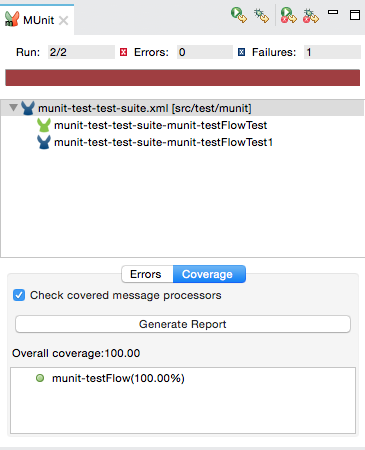
The Overall coverage value represents the percentage of the Mule application message processors that have been executed by the MUnit test.
You can click the Generate Report button to get the report detailing the flows and message processors contained by the Mule configuration files that were included in the MUnit test.
| Column | Description |
|---|---|
Resource |
The name of the Mule Configuration file. |
Flows |
Number of Flows inside the Mule configuration field. |
Weight |
This field represents how much of your application is contained inside a configuration file. |
Coverage |
This field represents the percentage of the message processors inside the Mule Configuration file that are being executed in the MUnit test. |
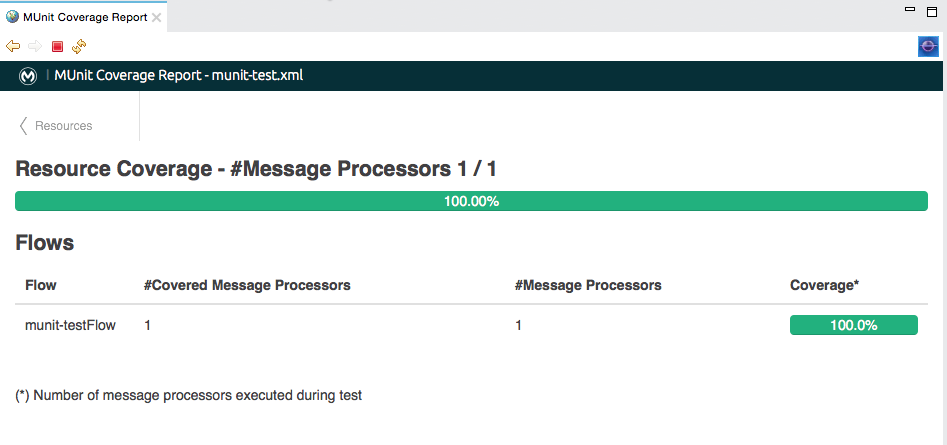
Additionally you can click in each Resource, to get a more specific and granular report of the message processors executed in that resource:
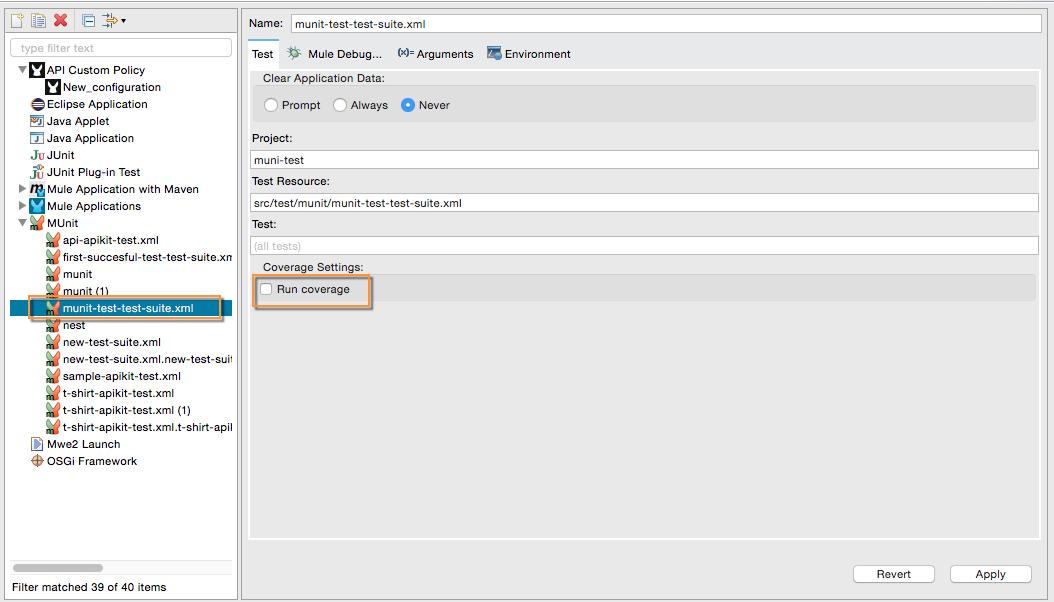
Disabling Coverage Reports
If you choose so, you can disable the coverage report generation from your project’s run configuration.
Right click in your Package Explorer, and choose Run As and Run Configurations…, Select your munit XML file to access your suite’s configuration, and deselect the "Run coverage" option under your Coverage Settings.
Debugging Tests
You can debug MUnit tests just like Studio applications, using Studio debugging perspective (for details on the debugging UI, see Studio Visual Debugger).
To access the debugging perspective, click Mule Debug on the top right of the Studio toolbar. This takes you away from the default Mule Design perspective to the debugging perspective, which displays debugging controls.
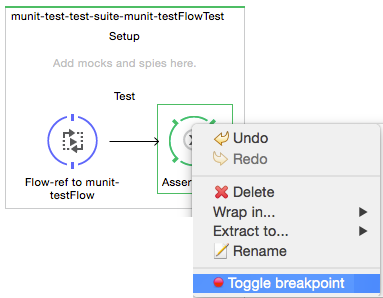
As with Mule applications, you can mark an MUnit message processor as a breakpoint, where a debug run should stop to enable you to see the information that reaches the message processor.
To debug a test, you can:
-
Right-click the test in the canvas, then select Debug MUnit test:
-
If you are working in the MUnit tab, you can select a test that previously ran, click the debug icon on the top right:
| In the event you have failed test you can select the button re-debug failed. This only debugs tests that fail. |
-
Or right-click the desired test, then select Debug:
|
MUnit comes bundled with Studio 5.4.0 and later. If you are running an older Studio version, you first need to install MUnit. Go to Check Munit and Munit Tools for Mule, and click Next to complete the installation. After installation, restart your Studio. |