API Visualizer Overview
API Visualizer (formerly Anypoint Visualizer) gives you a real-time, graphical view of your entire application network, including APIs, Mule applications, and the third-party systems they invoke. The graph updates automatically and requires no prior configuration. Use it to explore dependencies, assess architecture, troubleshoot performance issues, and verify that APIs comply with your organization’s policies.
This image shows a typical application network in API Visualizer.
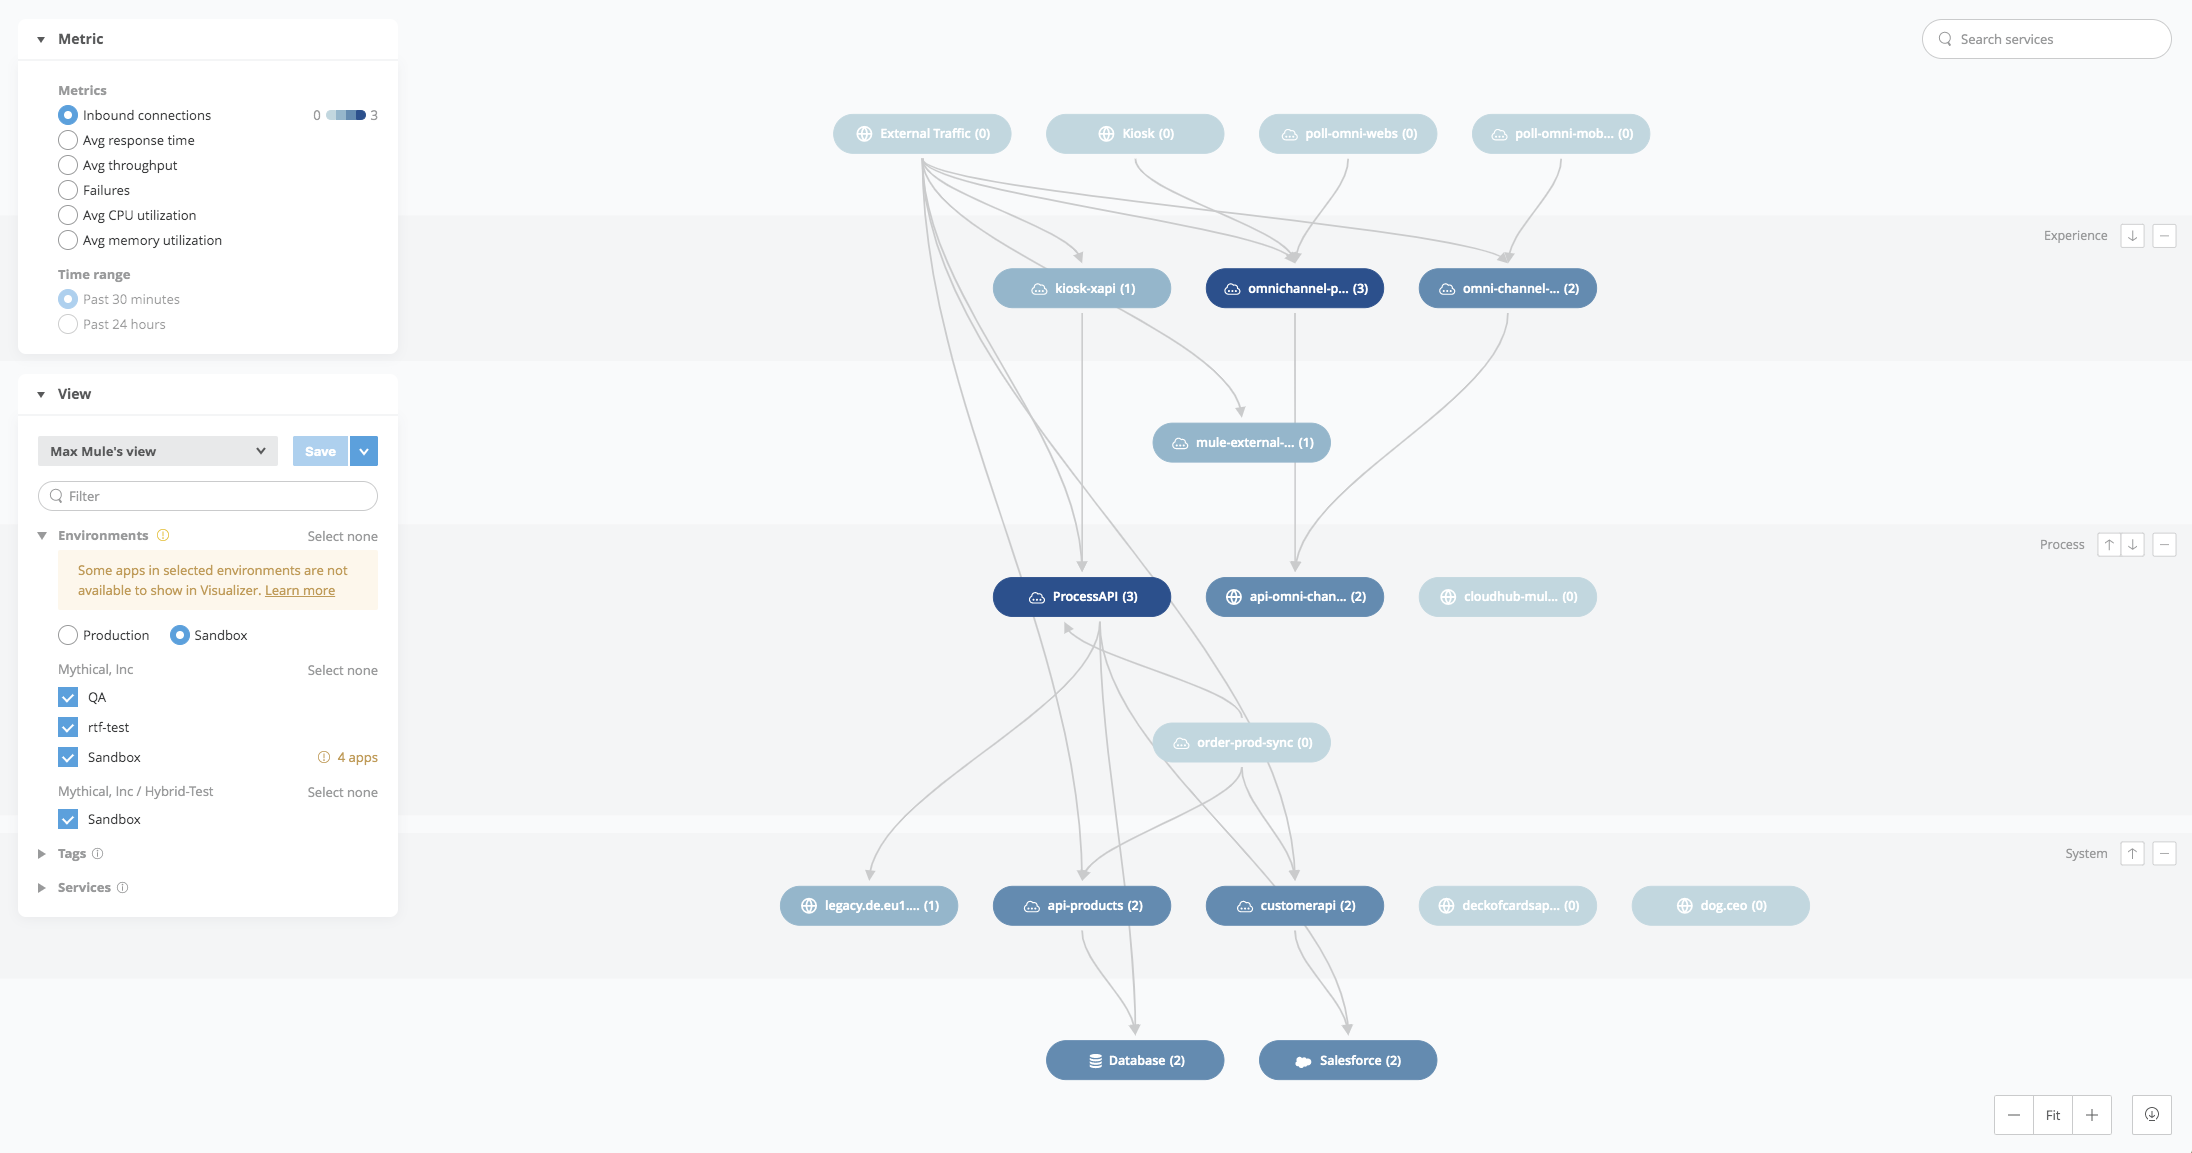
The connections between nodes are based on traffic between applications or APIs that occurred in the last seven days. If an application appears in multiple workers, the application appears as two distinct nodes in the graph.
API Visualizer collects data from Mule applications, APIs, and proxies deployed to CloudHub; from standalone Mule runtime engines (Mule instances); or from Runtime Fabric, to discover all incoming and outgoing connections through an embedded plugin. As long as the application, API, or proxy is running on a supported Mule instance, it’s discovered along with any associated dependencies. See How API Visualizer Collects Application Data for more information about how API Visualizer collects data displayed in the graph.
Understanding these dependencies helps you make better decisions, especially when you overlay data about these apps onto the network diagram. The visualizations tailored for Architecture, Troubleshooting, and Policies help you understand this data in the context of your application network. From API Visualizer, you can inspect performance metrics or policy information, define views, arrange applications in layers, and customize the labels displayed for nodes and connections. For more information, see Customize the Canvas.
Use Cases
API Visualizer supports several common use cases.
-
Discussing the Current Design State
Enterprise architect Kara developed a plan for how the architecture she’s responsible for will accommodate a new product. She needs to capture its current state so she can plan the transition and get buy-in from stakeholders on her proposal. She uses the Architecture visualization to assess the structure of her network and export a diagram to share with her audience. -
Implementing API-Led Connectivity
Site reliability engineer Tom is tired of maintaining several separate connections to Salesforce. He wants to identify redundant point-to-point connections so he can come up with requirements for a new process API. Tom views the network topology using the Architecture visualization to see if there are redundant connections. -
Exploring the Application Network
API Visualizer provides a real-time view of the application network. Architects and product owners can see how the application network evolves, explore the application network to discover and plan how to unlock data, and break down siloed systems, all while knowing that the visualization is always up-to-date. They can use the Architecture visualization to plan how to connect systems more efficiently. -
Defining API-Led Connectivity Classifications
API Visualizer enables you to assign the nodes of the graph to layers. Layers help you quickly determine if the APIs are correctly categorized, and if the architectural principles of API-led connectivity are being followed. The Architecture visualization enables you to organize the nodes efficiently so that API-led connectivity is easy to interpret. -
Accelerating Time-to-Production
Architect Kara sees how projects are built from the development environment, throughout testing, staging, and production phases. Kara reviews the architecture as the code is deployed and raises any concerns to make sure that best practices and agreed-upon architecture are followed without waiting for the documentation to be generated. Using the Architecture visualization, Kara monitors the deployment and organization of assets in real time. Using the Policy visualization, she makes sure all APIs are compliant with InfoSec rules before promoting a project to production. -
Resolving Production Issues Faster
API Visualizer enables you to understand the behavior of all your APIs and their dependencies in a single view, which reduces the time needed to pinpoint the root cause of an error or understand the performance impact of a particular API on your clients. The Troubleshooting visualization provides insight into performance issues, enabling you to identify errors and quickly navigate to information provided by Anypoint Monitoring. -
Ensuring Policy Compliance
Lead API Architect Ayesha needs to understand which APIs comply or don’t comply with policies mandated by InfoSec. With the Policy visualization, she selects a set of policies, sees which APIs have none, one, or all of these policies applied, and verifies adherence to company standards before promoting an API or project to production.
API Visualizer Features by Control Plane
API Visualizer feature availability depends on the control plane of your Anypoint Platform instance. Data isn’t shared across separate instances.
All API Visualizer features are available on US Cloud, EU Cloud, Government Cloud, and Private Cloud (3.x).
This table shows feature availability for Hyperforce clouds.
| API Visualizer Feature | Americas | Europe | Asia Pacific | ||
|---|---|---|---|---|---|
US Cloud |
Canada Cloud |
EU Cloud |
Japan Cloud |
India Cloud |
|
Architecture |
Available |
Available |
Available |
Available |
Available |
Policies |
Available |
Available |
Available |
Available |
Available |
Troubleshooting |
Available |
Planned |
Available |
Planned |
Planned |
For more information about MuleSoft Government Cloud and Anypoint Platform Private Cloud Edition (Anypoint Platform PCE), see Control Plane Hosting Options.