Step 9: Monitor the Automation
After publishing the process to Exchange and executing it from Composer, use the Process Monitoring module to see a summary of the deployed bots and the process executions.
Step 9.1: See a Live Stream of the Deployed Process
To see a live stream of the deployed process:
-
In Composer, open the flow you created in Step 8.1: Create a New Composer Flow for editing and click Test.
-
Switch to RPA Manager and open the Process Monitoring module.
-
Click on Process Streaming.
-
Refresh the page and click Show process streams.
If the button is disabled and shows No sessions running, it means the process has not started yet. In that case, refresh the page and try again.
-
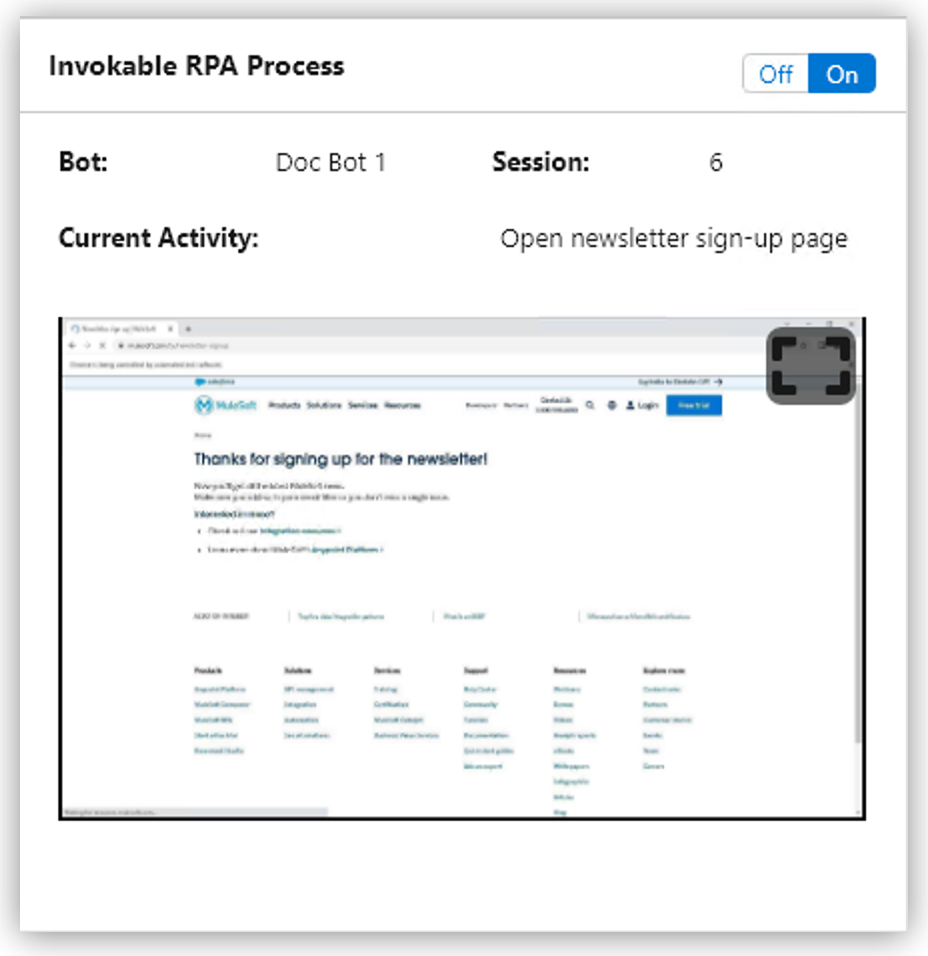
Click On to enable showing screen captures of this process.

The Process Streaming section shows a window for each run configuration that is currently executing. The stream consists of a sequence of images that the RPA bot records during process execution.
| If this section shows empty, it is possible that the execution of the process has already finished, meaning that it is not running now and it cannot provide a stream of the process. |
Step 9.2: Monitor the Deployed Process
To see the active bots and the deployed processes:
-
In RPA Manager, open the Process Monitoring module.
-
Click on Bot State and Operation.
The Bot State and Operation section shows a list of your configured bots and the current process executions.

Note that the Work done column shows 1, which confirms that the execution of the process finished one time.
Next Steps
At this point you finished creating a Composer Flow that calls an automated process that you previously created and published to Exchange using MuleSoft RPA.
You can use this project as a template or starting point to develop further automation projects and integrations between MuleSoft Composer and RPA.


