Correlation ID
When Mule creates a new event, it generates a unique identifier string called a correlation ID before sending the event to the next processor in the flow. This ID enables you to correlate different log entries with a particular execution.
Use the correlation ID to understand the entire history of an event that resulted in an issue or an unhandled error (all errors include the correlation ID of the event that triggered it). Also, knowing the correlation ID helps you perform a memory analysis of heap dumps.
To obtain a correlation ID, Mule first checks for one in the source message (for example, a JMS message or an HTTP listener with the X-CORRELATION-ID header). If the source does not set a correlation ID, Mule generates one using the correlation ID generator.
Modify the Correlation ID Generator
Although it is best to avoid making changes to the correlation ID generator, you might need to format the correlation ID for the events if:
-
Your company has its own standard or format for correlation IDs.
-
Your external system correlation IDs are a different length than those in Mule, causing an incompatibility that makes them untraceable.
To change how Mule generates the correlation ID:
-
Add the
<configuration>component to your application XML. -
Set the
correlationIdGeneratorExpressionattribute to specify the expression that generates the correlation ID:<configuration correlationIdGeneratorExpression="#[<custom_generator_expression>]"/>
| Ensure that the algorithm you use cannot generate the same correlation ID for two different events. |
Correlation ID Generator Configuration Example
In the following example, Mule generates the correlation ID by calling the Java uuid() method, and then replaces the dashes (-) with dots (.):
<configuration correlationIdGeneratorExpression="#[uuid() replace /-/ with('.')]"/>

<http:listener-config name="HTTP_Listener_config">
  <http:listener-connection host="0.0.0.0" port="8081" />
</http:listener-config>
<flow name="example">
  <http:listener config-ref="HTTP_Listener_config" path="/test"/>
  <set-payload value="some"/>
  <logger level="WARN" message="#[payload]"/>
</flow>
After executing the flow, the logger shows the following:
WARN 2021-03-30 16:46:11,269 [[MuleRuntime].uber.06: [test-project-app].example.CPU_LITE @6d3b5ad] [processor: example/processors/1; event: b5a95a63.f190.4c91.880a.5b54512fa6b1] org.mule.runtime.core.internal.processor.LoggerMessageProcessor: some
In this case, the value b5a95a63.f190.4c91.880a.5b54512fa6b1 is the correlation ID.
Change the Correlation ID During the Flow Execution
You might want to change the correlation ID of the event for a given scope or a set of operations if:
-
You are processing the results of a database query inside a
foreachscope and you want to correlate the event with the register you are processing. -
You are consuming a JMS message queue and you want to proceed using the JMS correlation ID for traceability purposes.
For these scenarios, installing the Mule Tracing module enables you to use the with-correlation-id scope to modify the correlation ID during the execution of said scope.
Install the Mule Tracing Module
To install the Mule Tracing module in your application:
-
Open your Mule project in Anypoint Studio.
-
Go to the Mule Palette.
-
Select Search in Exchange, and search for the Mule Tracing module.
-
Select the module and click Add.
-
Click Finish.
Configuration Example
Consider the following Mule application:
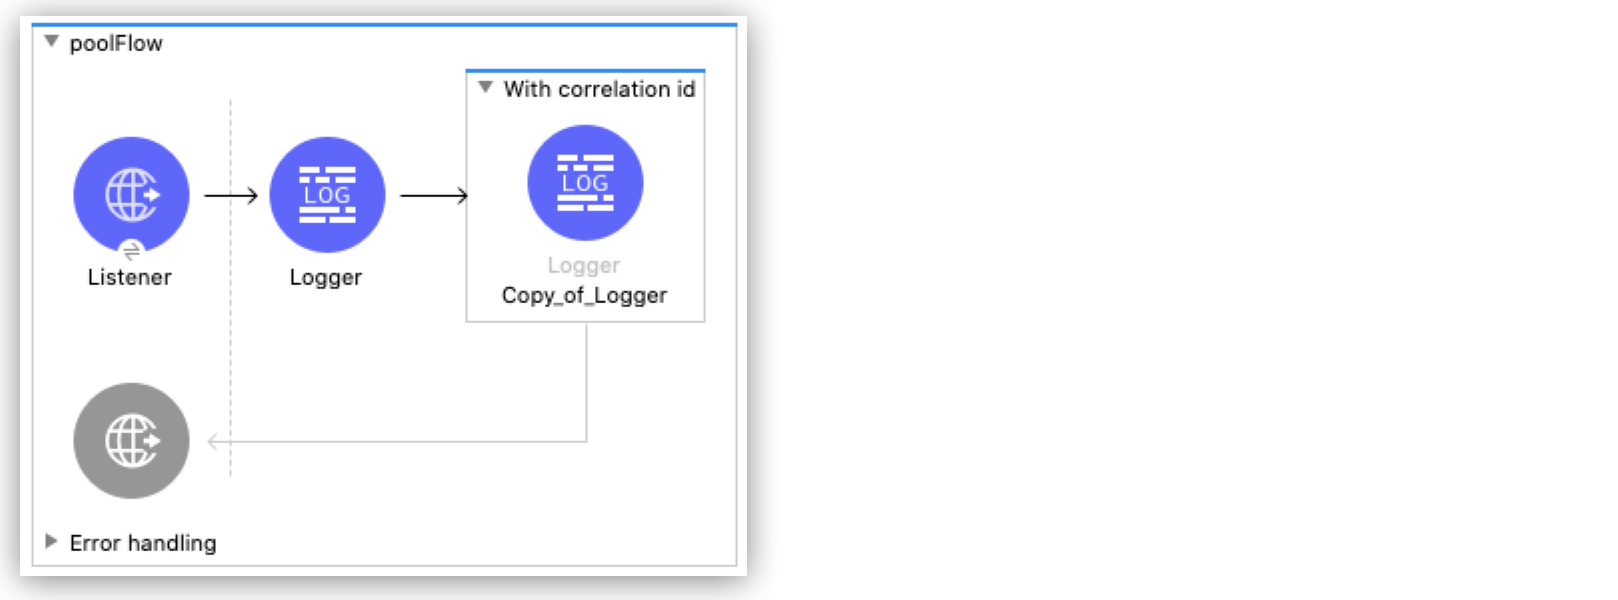
Application XML configuration:
<http:listener-config name="HTTP_Listener_config">
  <http:listener-connection host="0.0.0.0" port="8081" />
</http:listener-config>
<flow name="example">
  <http:listener config-ref="HTTP_Listener_config" path="/test"/>
  <set-payload value="some"/>
  <logger level="WARN" message="#[payload]"/>
  <tracing:with-correlation-id correlationId="#[correlationId ++ '-EXAMPLE']">
    <logger level="WARN" message="#[payload]"/>
  </tracing:with-correlation-id>
  <logger level="WARN" message="#[payload]"/>
</flow>
In this case, after the application executes the flow, the output logs are:
WARN  2021-03-30 16:46:11,269 [[MuleRuntime].uber.05: [test-project-app].example.CPU_LITE @6d3b5ad] [processor: example/processors/1; event: bad0e5b0-9191-11eb-a0b3-36548d51aeee] org.mule.runtime.core.internal.processor.LoggerMessageProcessor: some
WARN  2021-03-30 16:46:11,271 [[MuleRuntime].uber.05: [test-project-app].example.CPU_LITE @6d3b5ad] [processor: example/processors/2/processors/0; event: bad0e5b0-9191-11eb-a0b3-36548d51aeee-EXAMPLE] org.mule.runtime.core.internal.processor.LoggerMessageProcessor: some
WARN  2021-03-30 16:46:11,274 [[MuleRuntime].uber.05: [test-project-app].example.CPU_LITE @6d3b5ad] [processor: example/processors/3; event: bad0e5b0-9191-11eb-a0b3-36548d51aeee] org.mule.runtime.core.internal.processor.LoggerMessageProcessor: some
Use the DEBUG Log Level to View Additional Correlation ID Logs
If you want to see additional logs related to the correlation ID, set the log level to DEBUG by adding the following code to your application XML:
<AsyncLogger name="org.mule.runtime.module.extension.internal.runtime.operation" level="DEBUG"/>
The updated logs display as follows:
WARN  2021-03-30 16:58:29,545 [[MuleRuntime].uber.05: [test-project-app].example.CPU_LITE @6d3b5ad] [processor: example/processors/1; event: bad0e5b0-9191-11eb-a0b3-36548d51aeee] org.mule.runtime.core.internal.processor.LoggerMessageProcessor: some
DEBUG 2021-03-30 16:58:29,548 [[MuleRuntime].uber.05: [test-project-app].example.CPU_LITE @6d3b5ad] org.mule.runtime.module.extension.internal.runtime.operation.ImmutableProcessorChildContextChainExecutor: Changing event correlationId from '4c355b30-9192-11eb-b79f-36548d51aeee' to '4c355b30-9192-11eb-b79f-36548d51aeee-EXAMPLE' in location example/processors/2
WARN  2021-03-30 16:58:29,555 [[MuleRuntime].uber.05: [test-project-app].example.CPU_LITE @6d3b5ad] [processor: example/processors/2/processors/0; event: bad0e5b0-9191-11eb-a0b3-36548d51aeee-EXAMPLE] org.mule.runtime.core.internal.processor.LoggerMessageProcessor: some
DEBUG 2021-03-30 16:58:29,566 [[MuleRuntime].uber.05: [test-project-app].example.CPU_LITE @6d3b5ad] org.mule.runtime.module.extension.internal.runtime.operation.ImmutableProcessorChildContextChainExecutor: Event with correlationId '4c355b30-9192-11eb-b79f-36548d51aeee-EXAMPLE' going back to '4c355b30-9192-11eb-b79f-36548d51aeee' (successful execution) in location example/processors/2
WARN  2021-03-30 16:58:29,568 [[MuleRuntime].uber.05: [test-project-app].example.CPU_LITE @6d3b5ad] [processor: example/processors/3; event: bad0e5b0-9191-11eb-a0b3-36548d51aeee] org.mule.runtime.core.internal.processor.LoggerMessageProcessor: some
Error Handling
If an error occurs, the error handler logs the correlation ID that corresponds to the flow or Try scope that contains the error handler, for example:
<flow name="example">
  <tracing:with-correlation-id correlationId="#[correlationId ++ '-EXAMPLE']">
    <raise-error type="APP:SOME"/>
  </tracing:with-correlation-id>
  <error-handler>
    <on-error-continue>
      <logger message="#[correlationId]"/>
    </on-error-continue>
  </error-handler>
</flow>
In this scenario, Mule logs the correlation ID set at the beginning of the execution, because the error stops the execution of the correlation ID scope, preventing it from setting the new correlation ID (#[correlationId ++ '-EXAMPLE']).
However, consider the following example:
<flow name="example">
  <tracing:with-correlation-id correlationId="#[correlationId ++ '-EXAMPLE']">
    <try>
      <raise-error type="APP:SOME"/>
      <error-handler>
        <on-error-continue>
          <logger message="#[correlationId]"/>
        </on-error-continue>
      </error-handler>
    </try>
  </tracing:with-correlation-id>
</flow>
In this scenario, because the error handler executes within the correlation ID scope, the correlation ID logged after the flow execution is the one configured in the correlation ID scope (#[correlationId ++ '-EXAMPLE']).
Example of Identifying the Correlation ID in Logs
Consider the following flow:
<http:listener-config name="HTTP_Listener_config">
  <http:listener-connection host="0.0.0.0" port="8081" />
</http:listener-config>
<flow name="example">
  <http:listener config-ref="HTTP_Listener_config" path="/test"/>
  <set-payload value="some"/>
  <logger level="WARN" message="#[payload]"/>
</flow>
After receiving a request, the flow produces the following log:
WARN 2021-03-30 14:19:52,862 [[MuleRuntime].uber.04: [test-project-app].example.CPU_LITE @7a3620f2] [processor: example/processors/1; event: 23d22940-917c-11eb-9209-3c22fb13cde7] org.mule.runtime.core.internal.processor.LoggerMessageProcessor: some
In this case, the value 23d22940-917c-11eb-9209-3c22fb13cde7 is the correlation ID. This ID is unique for the corresponding event, so any other log that includes this correlation ID is referring to the same event.
Example of Logging the Same Correlation ID from Different Operations
Consider the following flow, which is the same as in the previous example but including a raise-error component:
<http:listener-config name="HTTP_Listener_config">
  <http:listener-connection host="0.0.0.0" port="8081" />
</http:listener-config>
<flow name="example">
  <http:listener config-ref="HTTP_Listener_config" path="/test"/>
  <set-payload value="some"/>
  <logger level="WARN" message="#[payload]"/>
  <raise-error type="APP:SOME"/>
</flow>
After its execution, the flow generates the following log:
WARN  2021-03-30 14:27:36,045 [[MuleRuntime].uber.08: [test-project-app].example.CPU_LITE @19afa17] [processor: example/processors/1; event: 37f0f591-917d-11eb-9209-3c22fb13cde7] org.mule.runtime.core.internal.processor.LoggerMessageProcessor: some
ERROR 2021-03-30 14:27:36,052 [[MuleRuntime].uber.08: [test-project-app].example.CPU_LITE @19afa17] [processor: example/processors/2; event: 37f0f591-917d-11eb-9209-3c22fb13cde7] org.mule.runtime.core.internal.exception.OnErrorPropagateHandler:
********************************************************************************
Message               : An error occurred.
Element               : example/processors/2 @ test-project-app:test-project-app.xml:16
Element DSL           : <raise-error type="APP:SOME"></raise-error>
Error type            : APP:SOME
FlowStack             : at example(example/processors/2 @ test-project-app:test-project-app.xml:16)

  (set debug level logging or '-Dmule.verbose.exceptions=true' for everything)
********************************************************************************
When the Logger and the Raise Error components execute, both components log the correlation ID 37f0f591-917d-11eb-9209-3c22fb13cde7. Note that this correlation ID is different from the one logged in the previous example.
Example of Setting the Correlation ID for a Database Query
The following example shows a scenario in which you can modify the correlation ID while processing the results of a database query:
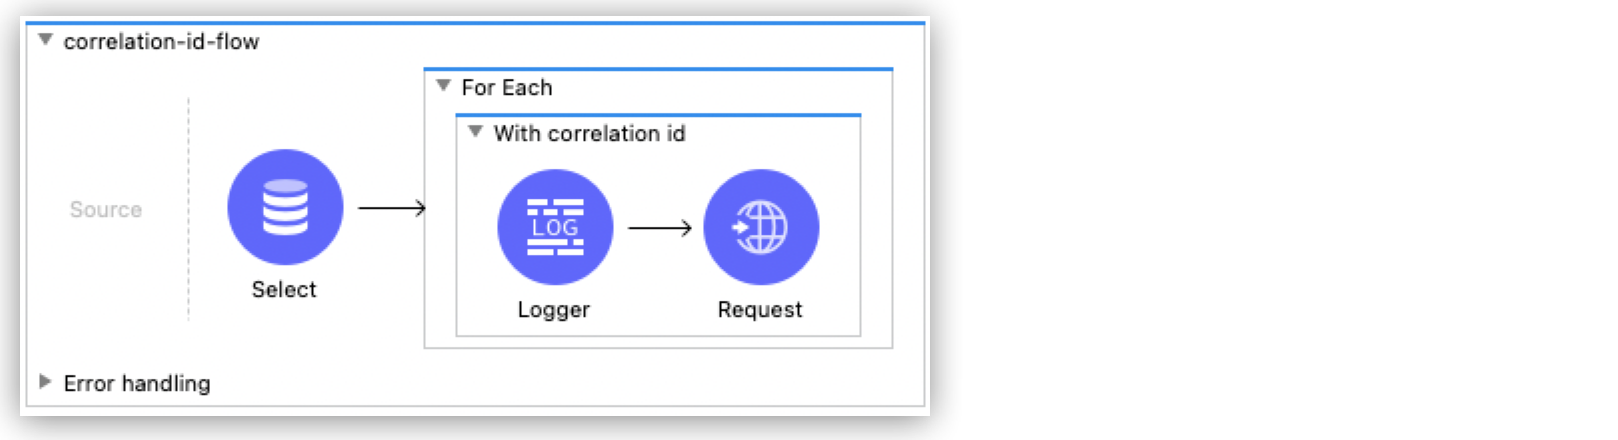
Application XML configuration:
<flow name="correlation-id-flow">
  <db:select config-ref="Database_Config">
    <db:sql ><![CDATA[SELECT orderId, customerId, total from Orders  ]]></db:sql>
  </db:select>
  <foreach >
    <tracing:with-correlation-id correlationId="#[payload.orderId]">
      <logger level="INFO" message="#[correlationId]"/>
      <http:request method="GET" url="http://a-service.com" sendCorrelationId="ALWAYS"/>
    </tracing:with-correlation-id>
  </foreach>
</flow>
In this case, each record obtained from the database is processed within the foreach scope, and the correlation ID for each iteration corresponds to the orderId of said record. In this scenario, if there is a problem during the HTTP request operation, the correlation ID enables you to track which record caused the error.