Troubleshooting Query Performance with Query Tracing
Query tracing in Anypoint DataGraph helps you analyze query performance by tracing every call made to the source APIs of the unified schema for a given query.
Trace results provide the following information:
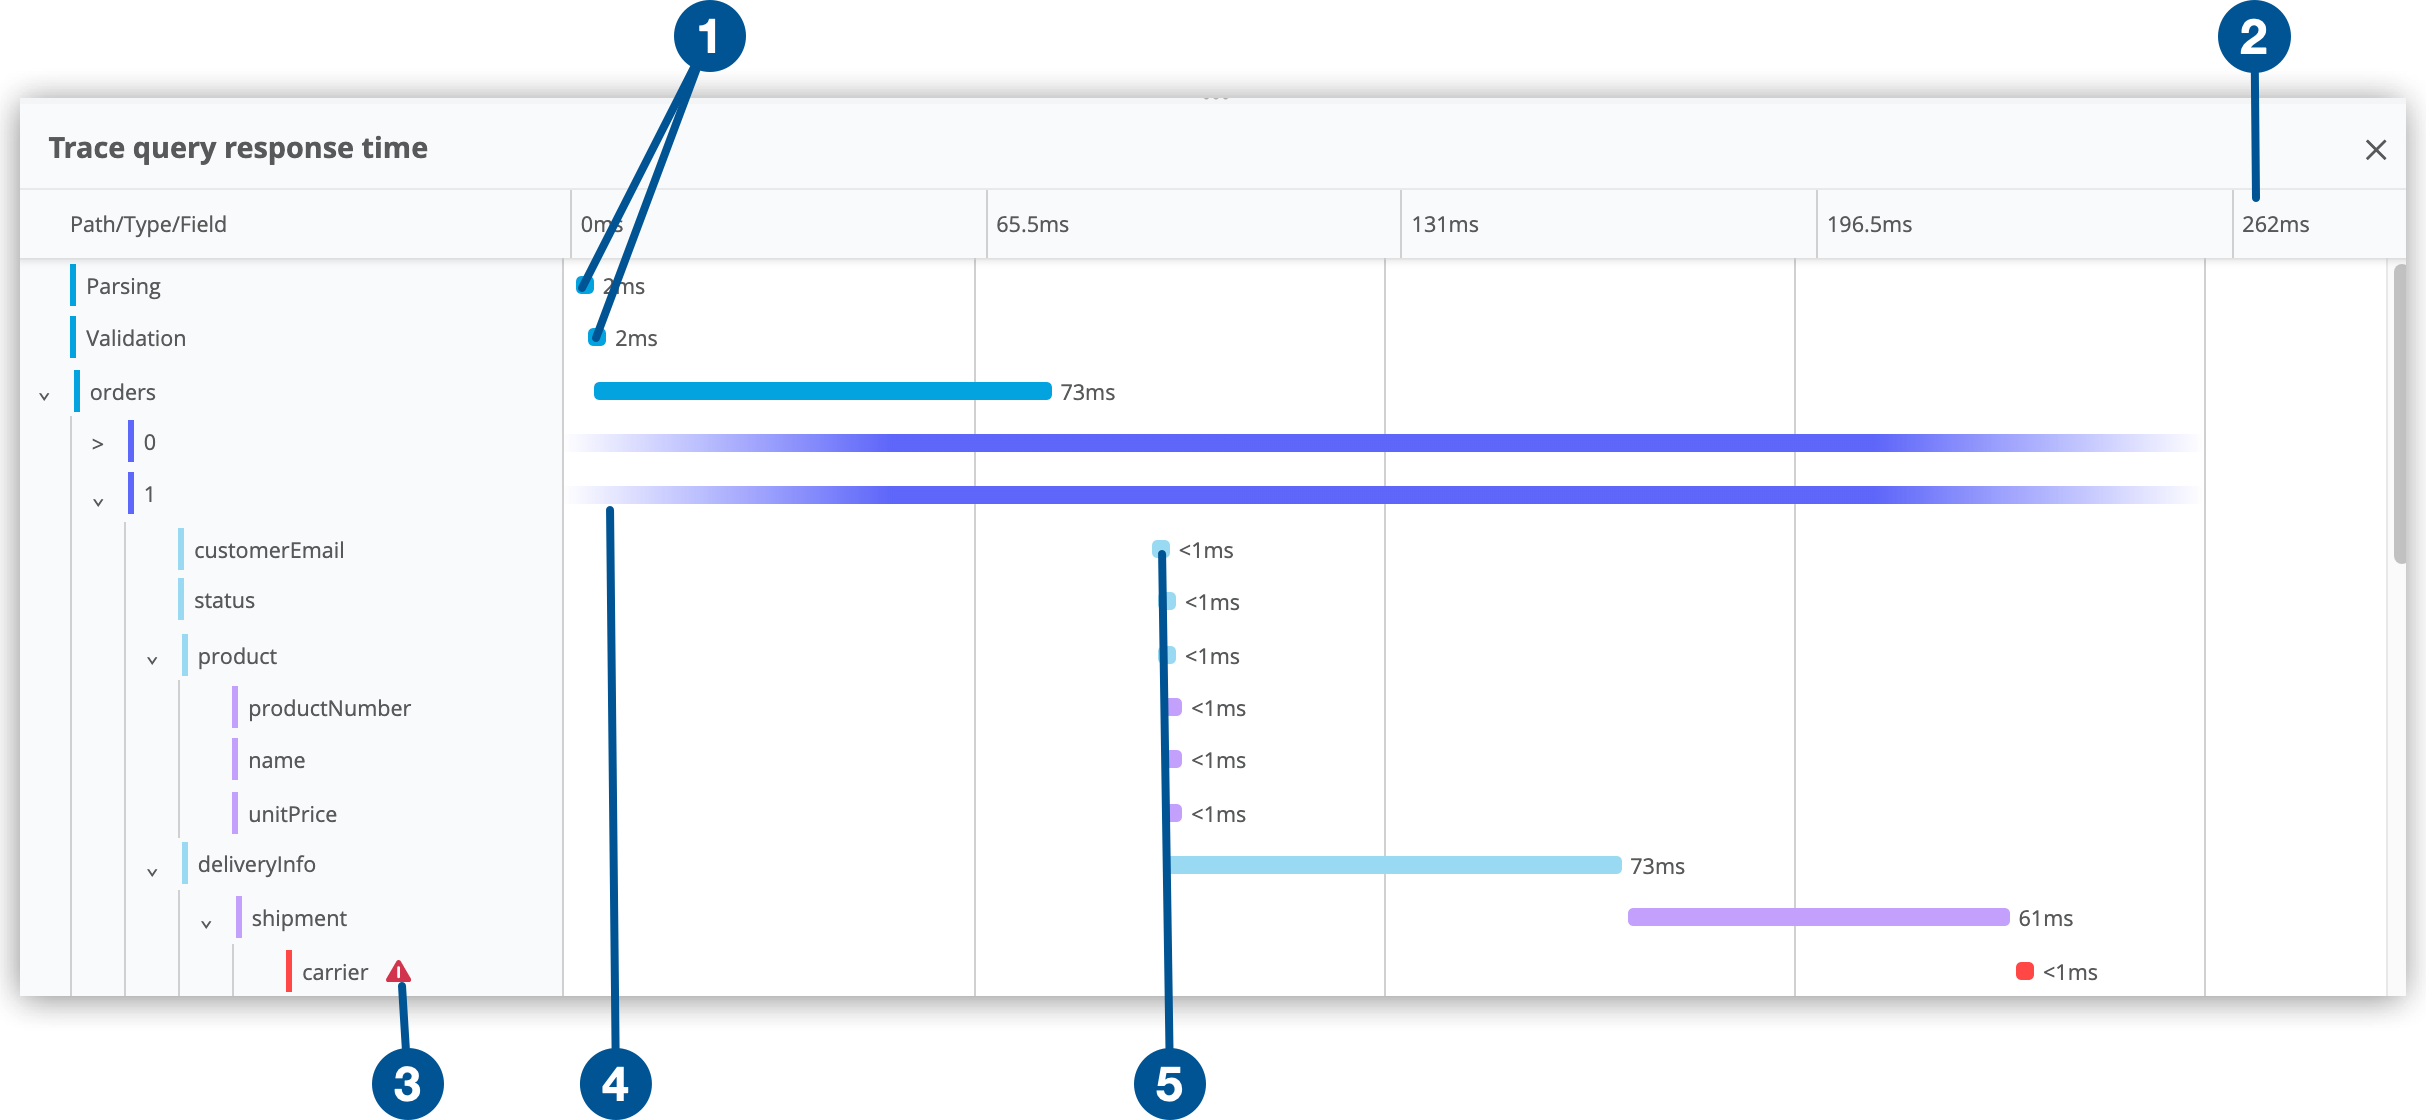
| 1 | Time taken by Anypoint DataGraph to parse and validate the query |
| 2 | Total response time for the entire query |
| 3 | Errors identified during query execution |
| 4 | Lack of trace information, denoted by a fading line |
| 5 | Duration of requests to each source API in the query |
Prerequisites
You must have the Contribute or Admin permission to use query tracing.
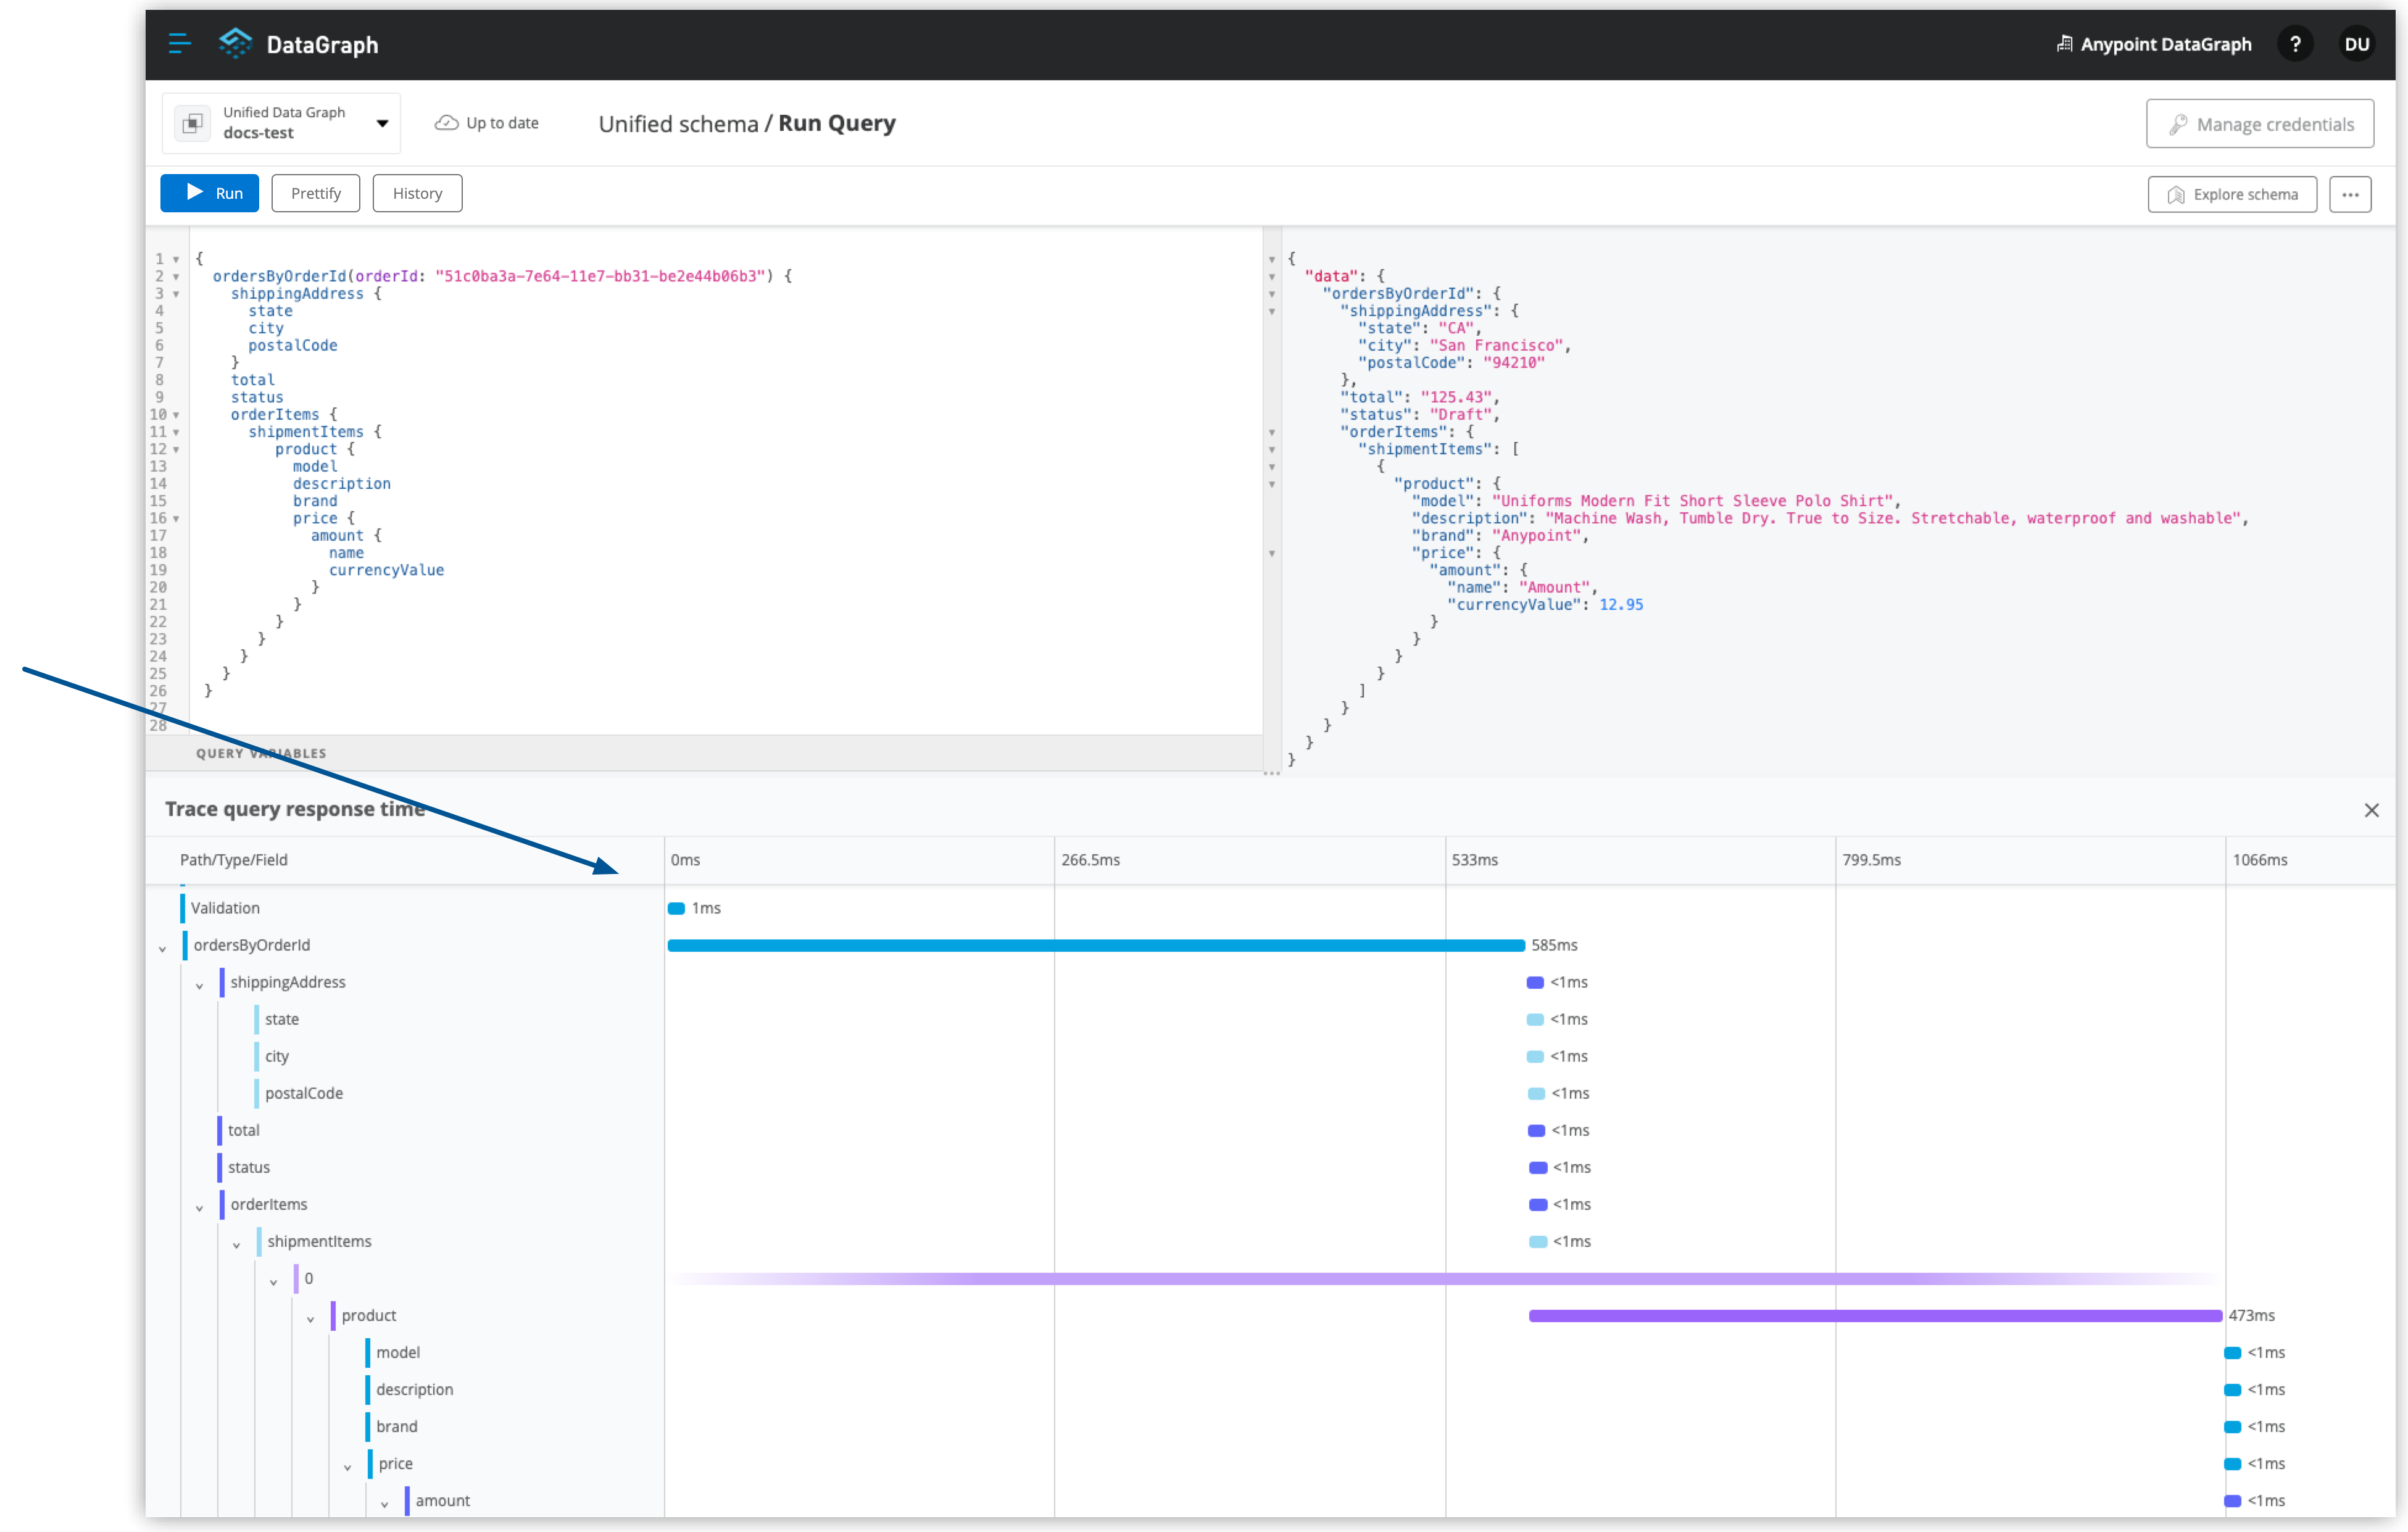
Run a Query Trace
Query trace results are provided as soon as you run an operation.
-
From the actions menu (…), select Trace Query.
-
Write your query.
-
Click Run.
The trace query panel opens and displays results:
You can collapse and expand the query trace panel as needed.