Viewing Usage Metrics for Anypoint Datagraph
Anypoint Datagraph provides API request metrics, and you can view additional usage metrics for DataGraph in Anypoint Monitoring.
View API Request Metrics
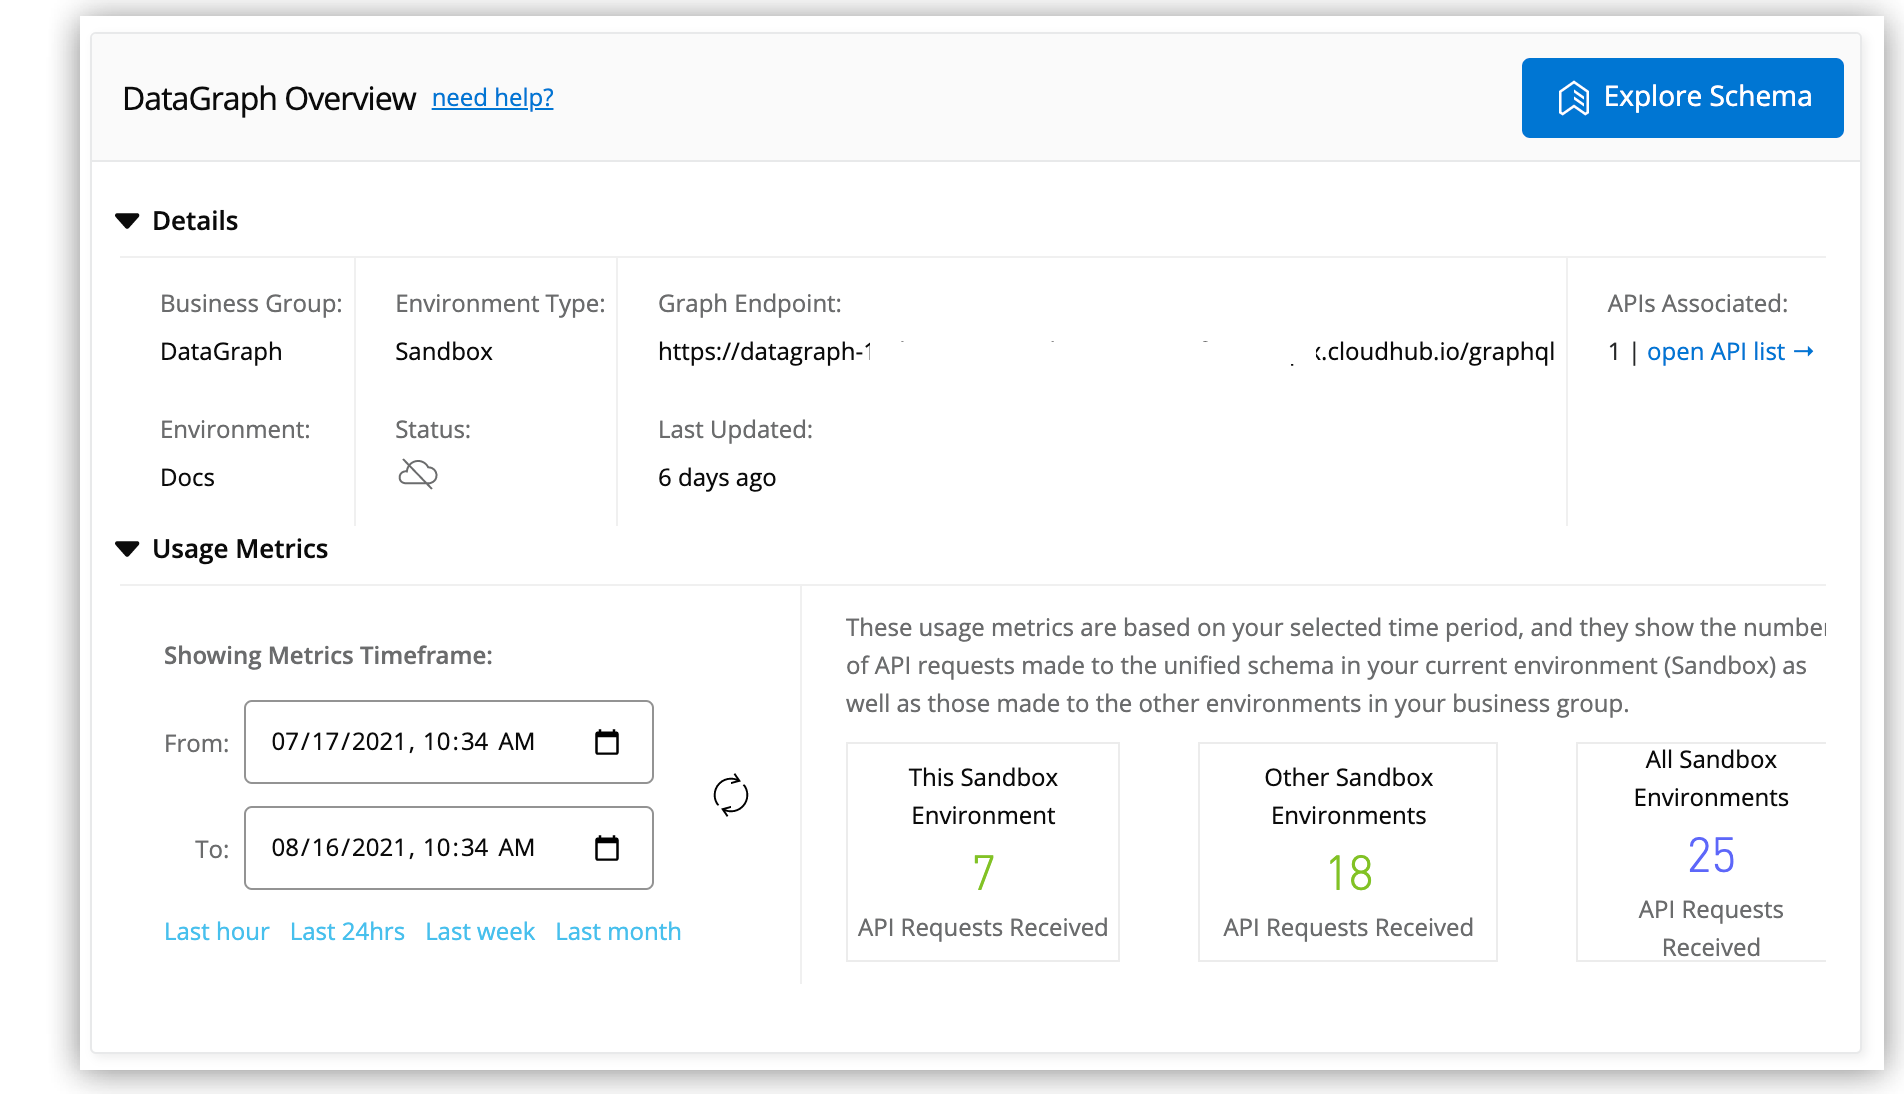
DataGraph enables you to track metrics so you’re always aware of your usage relative to the limits specified for your business groups. Use these metrics to track the total number calls made to the unified schema in each environment.
Usage metrics are separated by Production and Sandbox environments per business group. More specifically, the metrics in any given environment show:
-
GraphQL API requests received for that environment
-
GraphQL API requests received for other environments of that type
-
GraphQL API requests received for all environments of that type
API request usage metrics are available in the Overview section of Anypoint DataGraph.
To view usage metrics, you need the Admin permission.
-
Click Overview.
-
Click Details and confirm you’re in the correct environment.
-
Click Usage Metrics.
-
To see metrics for a specific time period, set the calendar parameters. The metrics query runs automatically and updates the data.
-
To refresh the metrics for the current time period, click the refresh icon.
View Usage Metrics with Anypoint Monitoring
Anypoint Monitoring enables you to view usage metrics via built-in dashboards and custom dashboards. These metrics relate to calls made to your DataGraph application, not to calls made to APIs federated in your unified schema.
Built-in Dashboards
In Anypoint Monitoring, DataGraph is considered a "managed API". You select the environment and the name of your DataGraph application when you view built-in dashboards.
Built-in dashboards require no configuration and include various pages to view different types of charts. For example, the overview page includes data related to:
-
Request volume
-
Failed requests
-
Total 4xx errors
-
Total 5xx errors
-
Average response time
Custom Dashboards
Custom dashboards collect the same metrics as built-in dashboards. They require additional configuration and are useful for:
-
Correlating diverse metrics
-
Performing comparative analysis
-
Differentiating between regular trends and anomalies
-
Isolating issues quickly
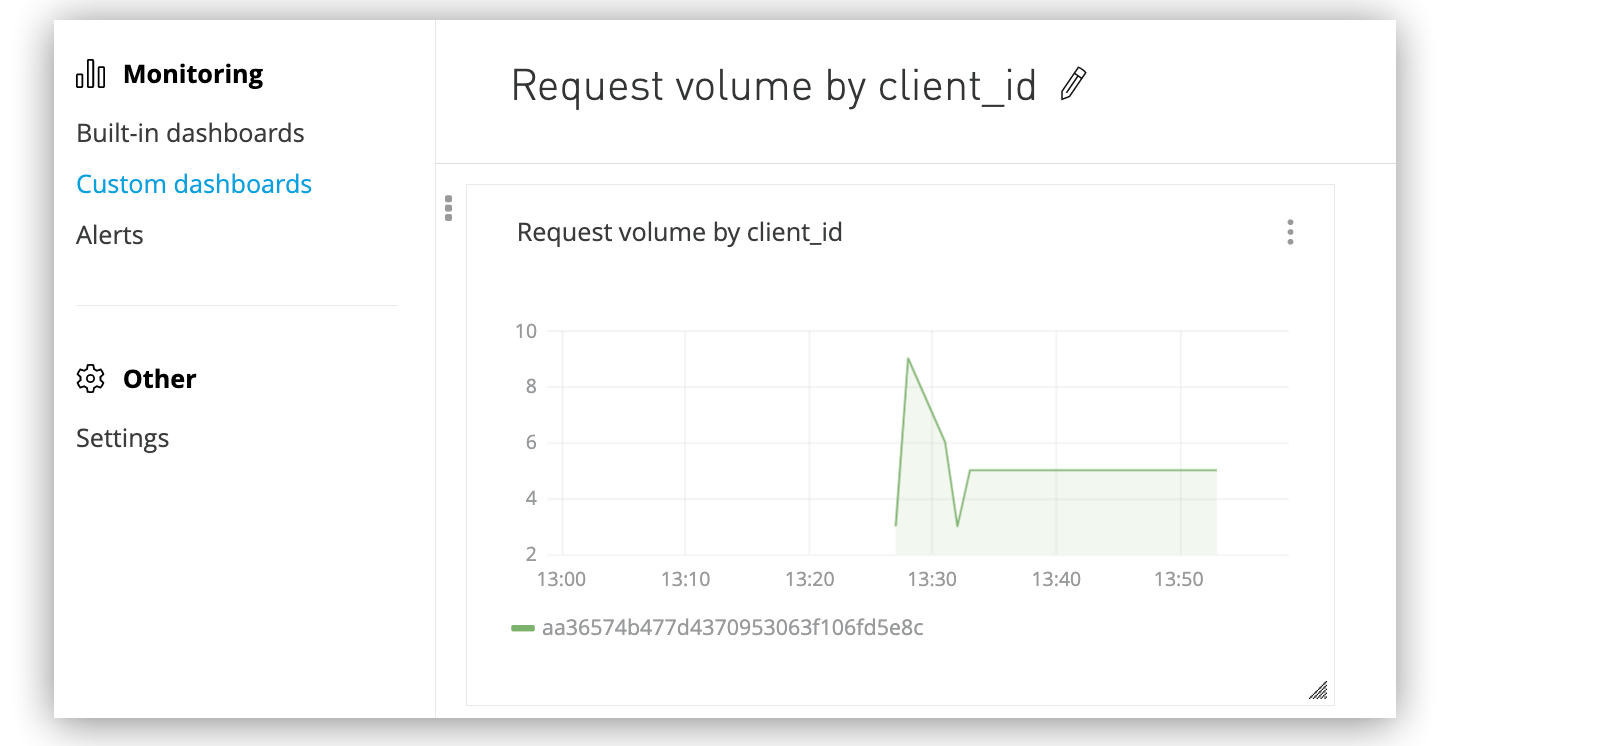
The following example shows how to set up a custom dashboard to track request volume by client_id.
-
From Anypoint Monitoring, select Custom dashboards.
-
Click +New Dashboard, add then select the graph option.
-
On the new graph, click the configure menu (the vertical ellipses), and then click Configure.
-
Switch the Advanced Mode toggle to activate advanced mode.
-
Edit the query as follows:
-
In the Panel Type drop-down list, select API Panel. (Datagraph is an API application type.)
-
Next to Where, click +.
-
From the drop-down lists, select
api_idandapi_version_idand set the value for each to the Datagraph application from which you’re collecting info. -
From the Select drop-down list, select
field(request_size.count). -
From the Group by drop-down list, select
tag(client_id). -
In the Alias by field, add
$tag_client_id.
-
-
Click Apply changes.
-
Open the time-picker, choose a timeframe, and click Confirm.
The following example shows a graph tracking requests over the previous hour: