
Configuring Custom Dashboards and Charts
You can create and configure as many custom dashboards as you need.
-
After you create a custom dashboard, you can configure dashboard-level properties, such as the name of the dashboard, any tags, its timezone, and metadata. See Performing Dashboard-Level Configurations.
-
You can configure one or more charts (also called widgets) for displaying your data in each row of a dashboard.

-
Graph: Can display a wide variety of metrics as time-series data. Graphs support a query language capable of pinpointing the data you need to see.
 Figure 1. Example: Graph
 -
Singlestat: Provides a summary statistic (a single total or number) for a single grouping of time-series data, such as a response time or a heap usage statistic.
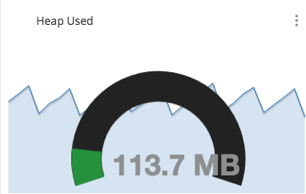 Figure 2. Example: SingleStat
 -
Table: Supports time-series data in a tabular format. It allows for cell coloring and date and value formatting.
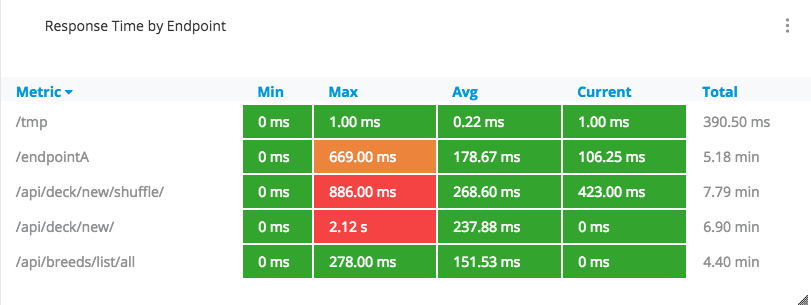 Figure 3. Example: Table
 -
Text: Provides an area for textual information (titles and descriptions) written in Markdown or HTML within rows or cells of a dashboard. For example, you might use it as a header for your dashboard.
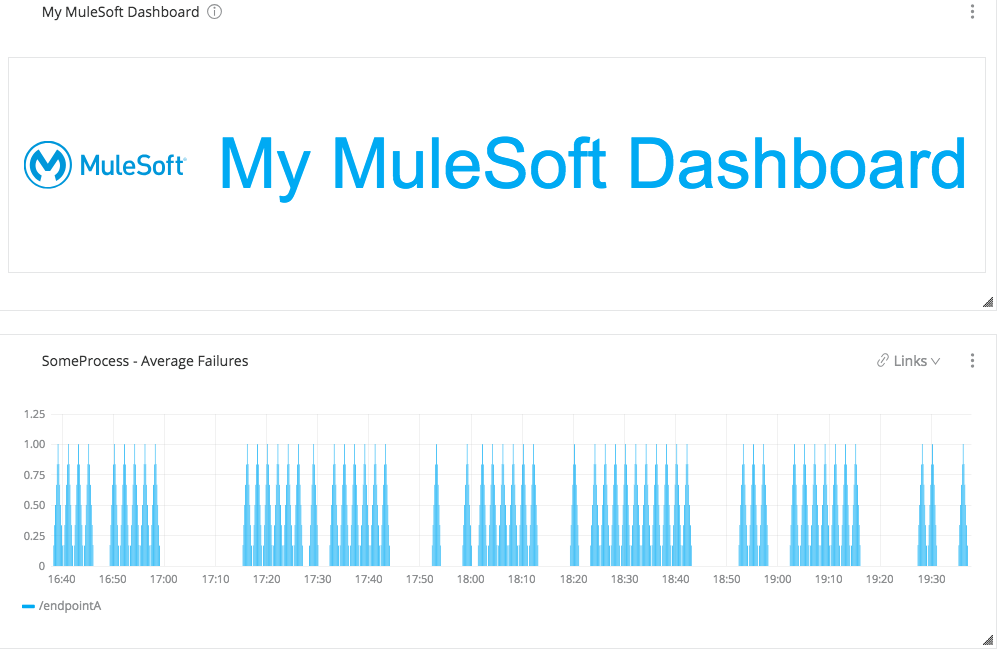 Figure 4. Example: Text Widget as a Dashboard Header
| There is a hard limit of 25 queries per custom dashboard panel. |
Configure a Dashboard
To perform dashboard-level configurations of custom dashboards, navigate to a custom dashboard and click the Pencil icon (beside the dashboard name) at the top of the page. Settings are for:
Configure General Dashboard Properties
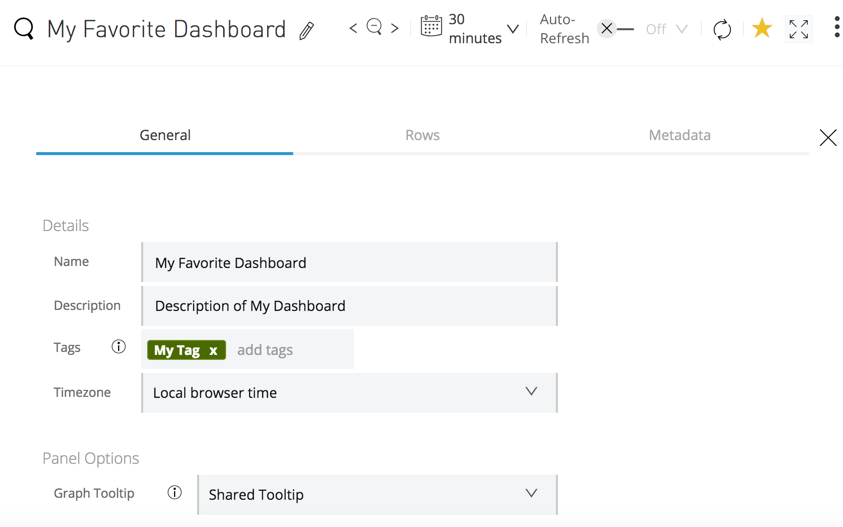
| General Dashboard Settings | |
|---|---|
Name |
Name for your Dashboard. |
Description |
Description that end users can see from the (i) icon. |
Tags |
A short identifier that can help you locate a dashboard in the custom dashboard list. |
Timezone |
Most graphs track data over time, so your time options are important. Your options are:
|
Graph Tooltip |
Options include: * Default: The crosshair cursor appears only in the chart that you mouse over. * Shared Crosshair: The crosshair appears on all charts. * Shared Tooltip: The crosshair and the tooltip appears on all charts. |
Configure Rows in a Custom Dashboard
Use the Rows tab for high-level custom dashboard configurations to provide titles for rows, move rows up or down in the dashboard, and delete rows.

| Row Configuration Options for Custom Dashboards | |
|---|---|
Title |
Title for your row. |
Show Title |
Make the title visible to end users. |
Up Arrow icon |
Move a row up in the dashboard when there is more than one row in the dashboard. |
Down Arrow icon |
Move a row down when there is more than one row in the dashboard. |
Trashcan icon |
Delete the row and any charts it contains from the dashboard. |
View Metrics on a Custom Dashboard
Use the Metadata tab for high-level custom dashboard configurations to view metrics on a custom dashboard.
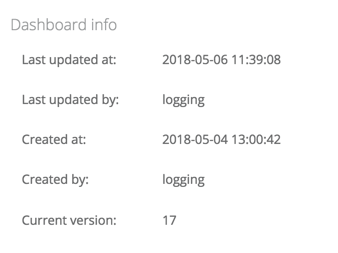
| Metadata Available for Custom Dashboards | |
|---|---|
Last Updated at |
Date and time of last update to the dashboard. |
Last Updated by |
User who made the last update. |
Created at |
Date and time the dashboard was created. |
Created by |
Username of person who created the dashboard. |
Current Version |
Version number of the dashboard. The version increments each time you save modifications to the dashboard. |
Add Charts to a Custom Dashboard
-
In the sidebar, click Custom dashboards from the sidebar.
-
To create a custom dashboard, click +New Dashboard.
-
If you need a new row for your chart, scroll down to find and click Add Row.
-
-
To add a chart to the row, click Add.

If chart icons aren’t visible in your row:
-
Mouse over the row to display the
 (More menu) for the row, and click + Add widget.
 -
Click one of the chart types for your row.
-
-
Mouse over the chart to display its
 (More menu), click Configure.
 -
To configure the chart in a custom dashboard, see:
Duplicate a Custom Dashboard
To create a copy of a custom dashboard:
-
From Custom Dashboards, open a custom dashboard.
-
From the dashboard’s header, click
 (More menu), and select Duplicate.
 -
Save a New Name for the dashboard.
Your copy of the dashboard opens.
Export App Data to a CSV
You can export app data to a CSV file, which you can then use in other apps.
-
From Custom Dashboards, open a custom dashboard.
-
From a chart’s header, click the
 (More menu), and select Export CSV.
For more information about how to export app data, see Export App Data to a CSV.


