Creating Custom Metrics
The Anypoint Custom Metrics connector enables you to send operational and business metric values that you define from an app to Anypoint Monitoring. You can then use the built-in Custom metrics dashboard and a custom dashboard in Advanced mode to visualize the custom metrics in real time.
Define metrics in the Anypoint Custom Metrics connector to select which metrics to display in the dashboard. You can filter and group the metrics along the dimensions you define to include multiple custom and built-in metrics in a single dashboard visualization.
Before You Begin
Run your Mule app on a supported Mule runtime version. For supported versions, see Mule Runtime Release Notes.
You must also install the Anypoint Monitoring Agent.
Review Custom Metrics Connector to understand connector configuration details. Connector configuration is required in your Mule app flow before you deploy or redeploy your app to a server or server cluster.
Locate the Custom Metrics Connector
In the sidebar, click Custom Metrics to locate Anypoint Monitoring Custom Metrics Connector. Alternatively, you can search for the connector in Anypoint Exchange.
Custom Metrics Best Practices
Best practices include using time period and frequency effectively as well as using data with low cardinality dimensions.
Use Time Period and Frequency Effectively
Each chart in the Custom Metrics dashboard represents the output of a query. Two parameters in the dashboard, time range and refresh frequency, affect the response time for the query that generates a chart.
- Time range
-
Determines how much data is fetched or processed to generate the chart. For example, more data is fetched and processed when displaying a monthly chart compared to displaying a daily chart.
- Refresh frequency
-
Determines how often a chart refreshes. High refresh frequencies put more stress on a system and can affect performance. For example, a refresh rate of one hour sends a query every hour, and a refresh rate of one minute sends the same query every minute.
Increasing time range (such as daily to monthly) or increasing refresh frequency (from one hour to one minute) affects the system response time. Reduce time range or reduce the refresh frequency to improve the chart response time.
Use Low Cardinality Dimensions
Most custom metric dimensions have less than 100 possible unique values, but some may have a thousand unique values, such as country_code, state_code, city_code, and zip. Do not add high cardinality data, or data with many unique values, to custom metrics. Some examples of high cardinality dimensions include customer_id, user_id, session_id, order_id, transaction_id, email_address, token_id, product_id, location_id (latitude/longitude), ip_address, and phone_number. Charts configured for custom metrics with high cardinality dimensions can adversely affect the response time of dashboards. For best results, restrict dimensions to have only a few unique values.
If a particular custom metrics chart slows down and affects other charts in the system, you can:
-
Create a new custom metric without the offending high cardinality dimension
-
Replace a high cardinality dimension with a low cardinality dimension, such as:
-
category_idinstead ofproduct_id -
country_codeinstead oflocation_id -
order_countinstead oforder_id
-
-
Avoid using UUIDs and timestamps when creating new custom metrics
-
Reduce the time range of the custom metric chart, for example, create a daily or weekly chart instead of a monthly or yearly chart
-
Reduce the refresh frequency, for example, refresh hourly instead of every minute.
| To ensure optimal performance, Anypoint Monitoring groups metrics based on unique combinations of your custom dimensions and supports up to 100 unique combinations. If your data exceeds this limit, lower-volume combinations are grouped under a single Other category. This limit applies to all custom dimensions combined. For more information, see Endpoint and Operation Metrics Collection (Other Group). |
Restricted Keywords
Due to internal database restrictions, you cannot use the following keywords to define dimensionName or factName while using the Anypoint Custom Metrics connector:
Restricted Keywords
-
ALL -
ALTER -
ANALYZE -
ANY -
AS -
ASC -
BEGIN -
BY -
CREATE -
CONTINUOUS -
DATABASE -
DATABASES -
DEFAULT -
DELETE -
DESC -
DESTINATIONS -
DIAGNOSTICS -
DISTINCT -
DROP -
DURATION -
END -
EVERY -
EXPLAIN -
FIELD -
FOR -
FROM -
GRANT -
GRANTS -
GROUP -
GROUPS -
IN -
INF -
INSERT -
INTO -
KEY -
KEYS -
KILL -
LIMIT -
SHOW -
MEASUREMENT -
MEASUREMENTS -
NAME -
OFFSET -
ON -
ORDER -
PASSWORD -
POLICY -
POLICIES -
PRIVILEGES -
QUERIES -
QUERY -
READ -
REPLICATION -
RESAMPLE -
RETENTION -
REVOKE -
SELECT -
SERIES -
SET -
SHARD -
SHARDS -
SLIMIT -
SOFFSET -
STATS -
SUBSCRIPTION -
SUBSCRIPTIONS -
TAG -
TO -
USER -
USERS -
VALUES -
WHERE -
WITH -
WRITE -
TIME
Configure Custom Metrics from Anypoint Studio
-
From Anypoint Monitoring:
-
Click Custom Metrics.
-
Click Custom Metrics Connector for the latest Mule version to open the connector on Anypoint Exchange.
-
Click Dependency Snippet, and copy the Maven snippet.
-
-
In Anypoint Studio, add the
<dependency/>snippet for the latest version of the connector to your Mule project’spom.xmlfile within the<dependencies/>element, for example:<dependencies> ... <dependency> <groupId>com.mule.modules</groupId> <artifactId>mule-custom-metrics-extension</artifactId> <version>2.3.1</version> <classifier>mule-plugin</classifier> </dependency> </dependencies>Your connector version value might differ from the example. After you add the dependency, the connector becomes available in the Studio palette.
If you encounter issues with this step, see Add Modules to Your Project to add the connector in Studio from Exchange.
-
From the palette, drag the Send Custom Metric operation to the canvas for your project.
-
Click the Send Custom Metric operation to add values for the operation.
-
Add the dimension for the metric:
-
In Metric name, enter a meaningful value, for example "sales."
For information about purged metric names, see Metric and Fact Names.
-
In Enter contextual information select Edit inline to enter the name and value for the dimension.
-
Click the green plus on the left to enter the values.
-
In the Dimension dialog box, enter the Name and Value for the dimension.
-
Leave the Collapsible option with the default of True.
-
Click Finish.
You can repeat these steps to add multiple key values.
-
-
Enter the facts for the metric. Values for measurements are numerical.
-
In Enter measurements select Edit inline to enter the name and value for the metric.
-
In the Fact dialog box, enter a Name and numerical Value for the fact.
-
To disambiguate fact names, use a fact name that is unique across your CloudHub applications.
-
Provide only numerical values for facts. Non-numerical values, which aren’t validated at design time, cause a runtime exception after deployment.
For more information about fact names, see Metric and Fact Names.
-
-
Leave the Collapsible option with the default of True.
-
Click Finish.
You can repeat these steps to add multiple key values.
-
-
Select the Throw runtime exception on validation failure option if you want the flow to break if invalid values are entered for the metric. If this option is left unchecked, an error is will be logged, but the flow won’t break.
-
Proceed to Get App Metrics in Anypoint Monitoring in Custom Dashboards.
Example: Using DataWeave When Sending Custom Metrics
This flow example uses custom-metrics:send to submit custom metric values defined as variables in ee:transform and ee:set-variable components.
<flow name="custom-metrics-flow" >
  <http:listener doc:name="Listener"
       config-ref="HTTP_Listener_config"
       path="test"/>
  <logger level="INFO" doc:name="Logger"
       message="about to send a custom metric"/>
  <ee:transform doc:name="Transform Message" >
    <ee:message >
    </ee:message>
    <ee:variables >
      <ee:set-variable variableName="metricFacts" ><![CDATA[%dw 2.0
output application/json
---
[
{
  factName: "request_count",
  value: 1
}
]]]></ee:set-variable>
  <ee:set-variable variableName="metricProperties" ><![CDATA[%dw 2.0
output application/java
---
[
{
      dimensionName: "response_type",
      value: "FAILED",
      collapsible: true
  }
]]]></ee:set-variable>
    </ee:variables>
  </ee:transform>
  <custom-metrics:send doc:name="Send Custom Metric"
      metricName="test-471243020"
      throwOnValidationFailure="true"
      facts="#[vars.metricFacts]"
      dimensions="#[vars.metricProperties]">
  </custom-metrics:send>
  <logger level="INFO" doc:name="Logger"
       message="custom metric processed"/>
</flow>
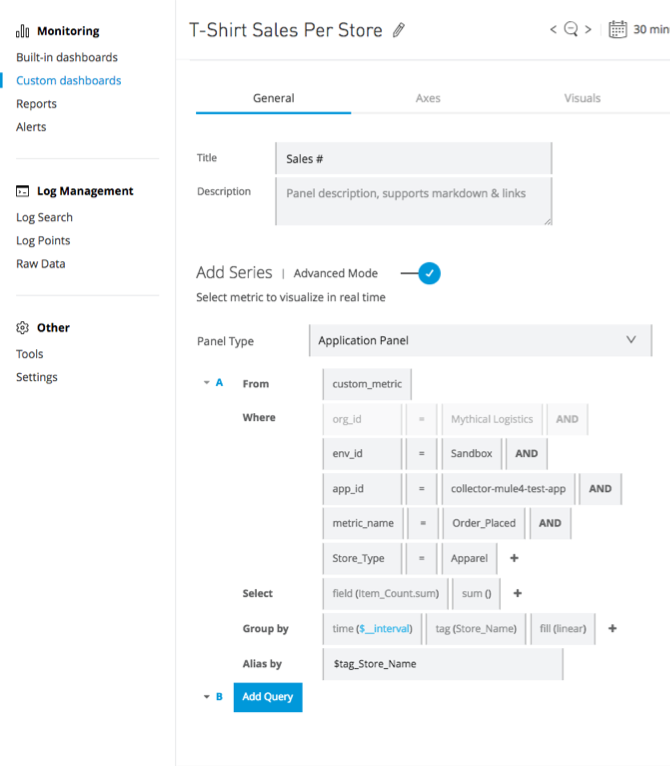
Get App Metrics in Anypoint Monitoring in Custom Dashboards
From Custom Dashboards in Anypoint Monitoring, you can add custom metrics to a custom dashboard to visualize the custom metrics you defined in your app.
| Custom metrics appear in the metric_name dropdown list only after an app starts emitting measurements for that metric. A custom metric that doesn’t produce measurements for two consecutive days no longer appears in the list. To use a custom metric, add it to a chart while it’s still actively producing data. |
-
Deploy the app.
For guidance, see Deploy Mule Applications.
-
In Anypoint Monitoring, add a new custom dashboard for the custom metric.
-
Configure a chart to use your custom metric.
For guidance, see Add Charts to a Custom Dashboard.
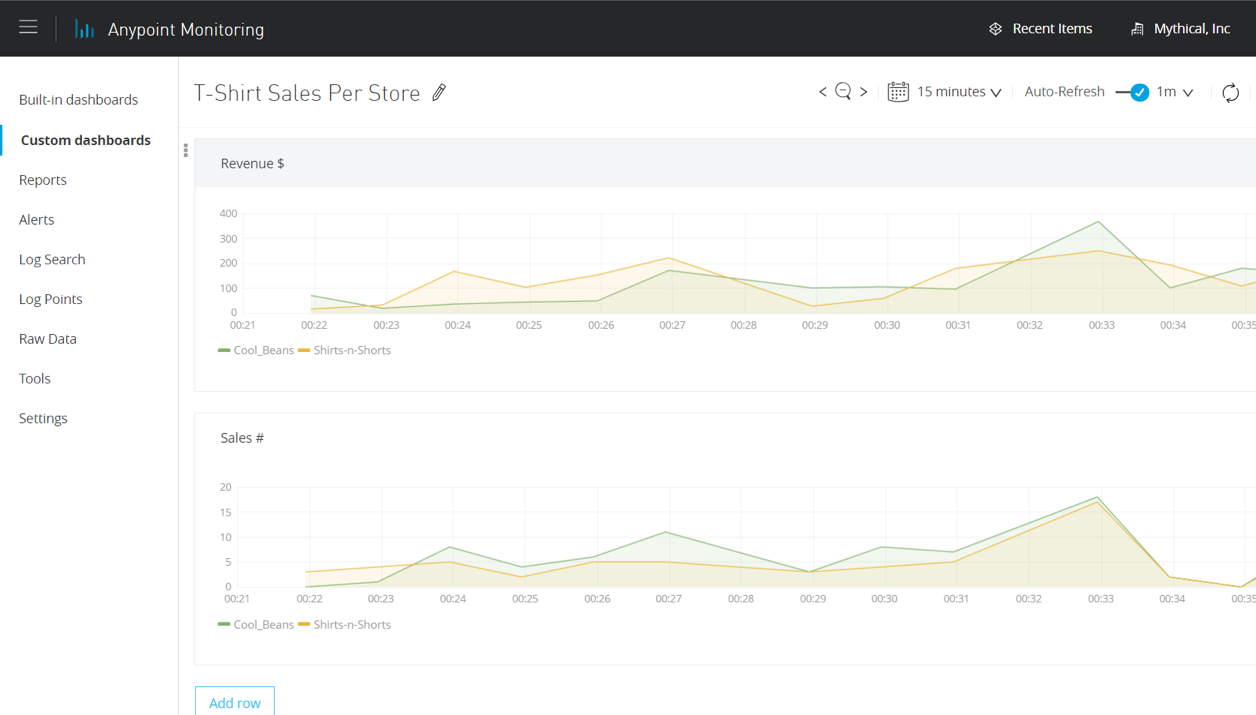
This example shows a configuration for a graph that displays t-shirt sales.
Configure Charts with Custom Metrics in a Built-in Dashboard
From Built-in Dashboards in Anypoint Monitoring, you can configure charts for Mule apps that are configured to produce custom metrics from the application’s Custom Metrics tab. For the corresponding charts in Anypoint Insights, see anypoint-insights.adoc#custom-metrics-chart-config[Custom Metrics for a Mule Application].
Custom metrics are not collected for the app until you configure the Custom Metrics Connector in your application flow and deploy the application to a server or server cluster.
-
In Anypoint Monitoring, select the application to view metrics for, and click View.
-
Click the Custom metrics tab.
If the Custom Metrics connector has collected one or more metrics in the specified time range, one chart per defined metric is displayed. 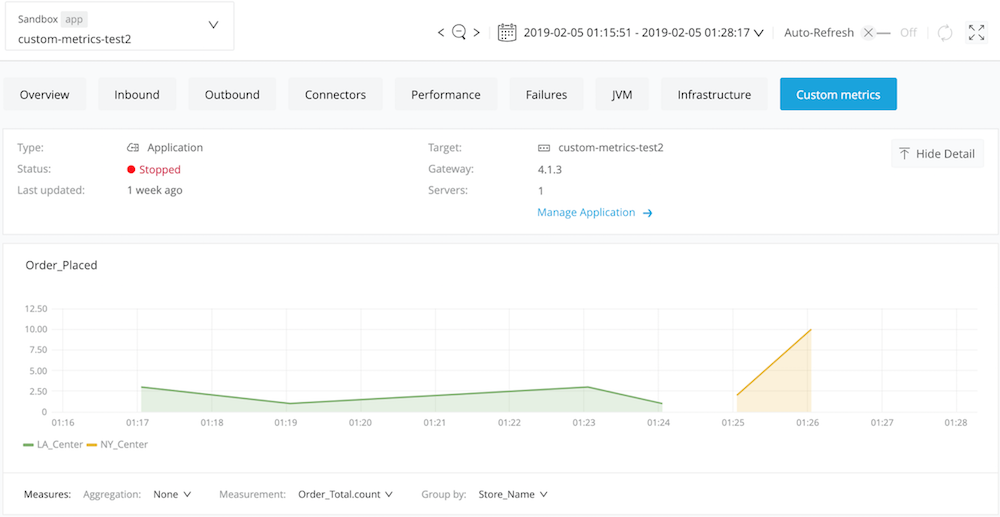
-
Click Select a measurement for this chart to display the measurement for the chart.
-
Use the drop-down lists at the bottom of the chart to filter the data by:
-
Aggregation - Possible aggregations include:
-
None (default) - No data aggregation.
-
count - Displays the total number of items collected for the measurement.
-
distinct - Returns the unique values for the given measurement.
-
integral - Returns the area under the curve for subsequent values.
-
mean - Returns the arithmetic average of the specified measurement over a given interval of time.
-
median - Displays the middle value for the collected metrics.
-
mode - Displays the most frequent value in the metrics collected for the defined measurement.
-
sum - Displays the sum of all the values for the defined measurement.
-
-
Measurement - The choices in this list are determined by the measurement values you define in the Custom Metrics connector.
-
Group by - The choices in this list are determined by the values you define in the Custom Metrics connector.
-
Metric and Fact Names
Before providing a fact name or attempting to rename a metric, keep these best practices in mind:
-
Use unique fact names across applications, and understand limitations on fact name deletions:
-
In the Custom Metrics tab of the built-in dashboard for an application, fact names defined in one CloudHub application are visible to other applications.
Best practice: Provide unique fact names across all CloudHub applications.
-
Fact names are removed from the dashboard only after the retention period expires. Other mechanisms for deleting or purging fact names aren’t supported.
Fact names that you remove with the Send Custom Metric operation of the Anypoint Monitoring Custom Metrics Connector continue to appear in the fact list within the Custom Metrics tab until the retention period expires.
-
-
Avoid changing metric names:
If you use the Send Custom Metric operation of the Anypoint Monitoring Custom Metrics Connector with a new metric name, the old metric name continues to appear in the Custom Metrics tab.