Monitoring Metrics from Dashboards
Built-In Dashboards
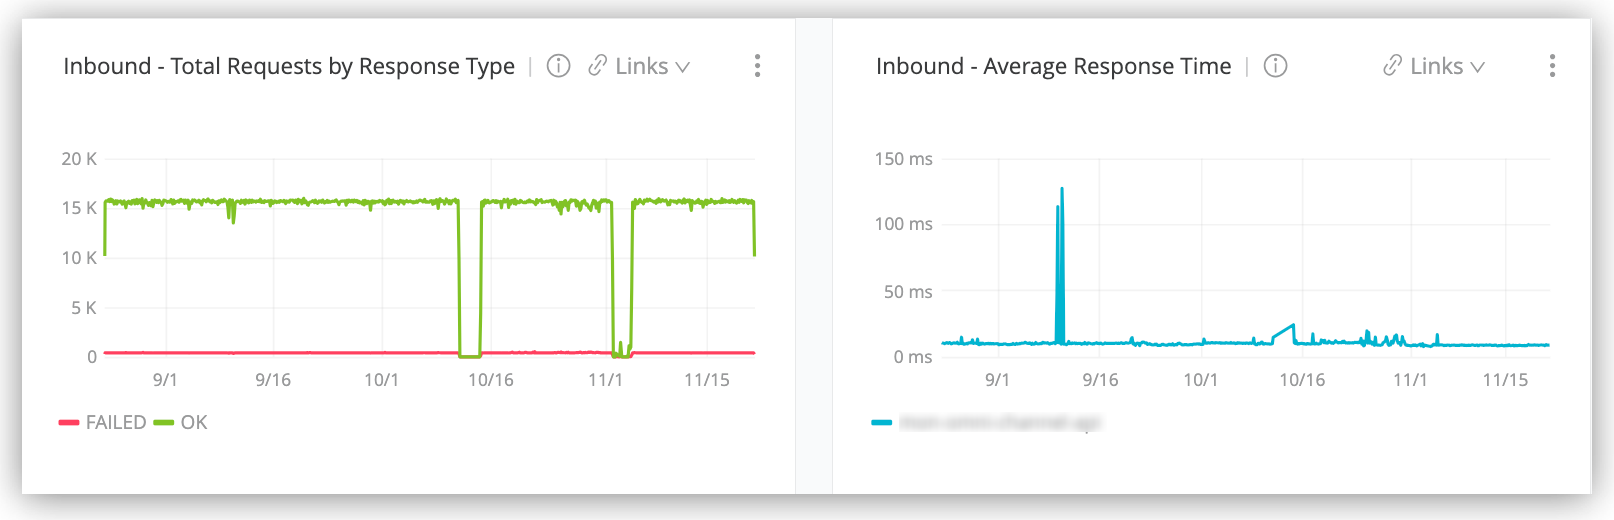
Built-in dashboards contain graphs that plot current and historical data collected over a given time and date period. There is a built-in dashboard for each Mule application and API in each environment.
Custom Dashboards
|
Custom dashboards in Anypoint Monitoring can bring together important metrics and data points that you need to see on one screen. You can specify the resources and metrics that you want to monitor, allowing you to:
-
Correlate diverse metrics
-
Perform comparative analysis
-
Differentiate between regular trends and anomalies
-
Isolate issues quickly
For example, you can compare live data with historic data to detect anomalies and expedite the troubleshooting process.
Causes of No Data Points Messages for Dashboards
A dashboard in Anypoint Monitoring might return No data points instead of metrics. The following scenarios commonly cause the No data points message to appear:
-
You selected an incorrect time range.
For example, the app started yesterday, and you selected a day from the past week as your time range.
-
You removed the Monitoring property from the runtime.
-
The application for which you are trying to view metrics has stopped.
-
You selected a time range that is outside of the retention policy of a metric.
For example, API path or client IP metrics show only the last hour, and you selected yesterday as the time range.
-
You used an incorrect query.
For example, when using custom dashboards, you selected two app IDs at the same time using the query
WHERE app_id = app_1 AND app_id = app_2.