API Functional Monitoring in Anypoint Monitoring
API Functional Monitoring enables you to monitor responses to requests sent to API resources at their endpoints. You monitor APIs by accessing the Functional Monitoring section of Anypoint Monitoring, which you select from the home page of Anypoint Platform.
The Functional Monitoring section contains tools for creating and editing monitors. Additionally, you can upload custom test suites written in BAT, a Behavior Driven Development (BDD) language.
The following image illustrates the components of a monitor:
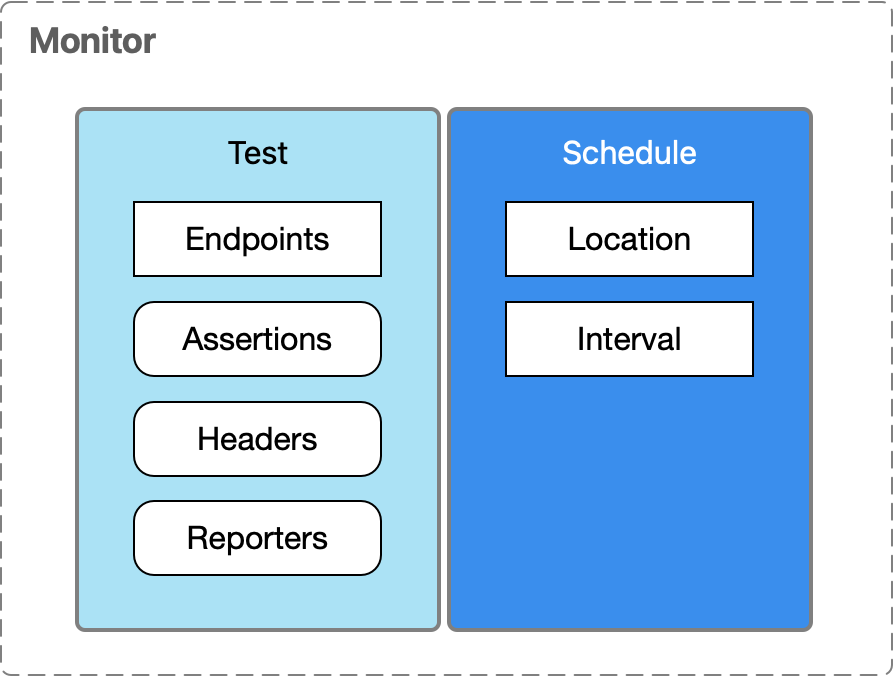
A monitor includes a test and one or more schedules for running tests.
A monitor test includes the following:
-
The endpoints to verify
-
Optional assertions to verify at the endpoints (for example, a 200 status code)
-
Optional HTTP headers to include when sending requests to the endpoints
-
Optional tools, such as SumoLogic and Slack, used to send test reports
A monitor test schedule includes the following:
-
The location from which to run the test
Locations can be public or private. For details, see Monitoring the Endpoints of Public APIs and Monitoring the Endpoints of Private APIs.
-
The time interval between tests
The Functional Monitoring page with a monitor selected is shown in the following image:
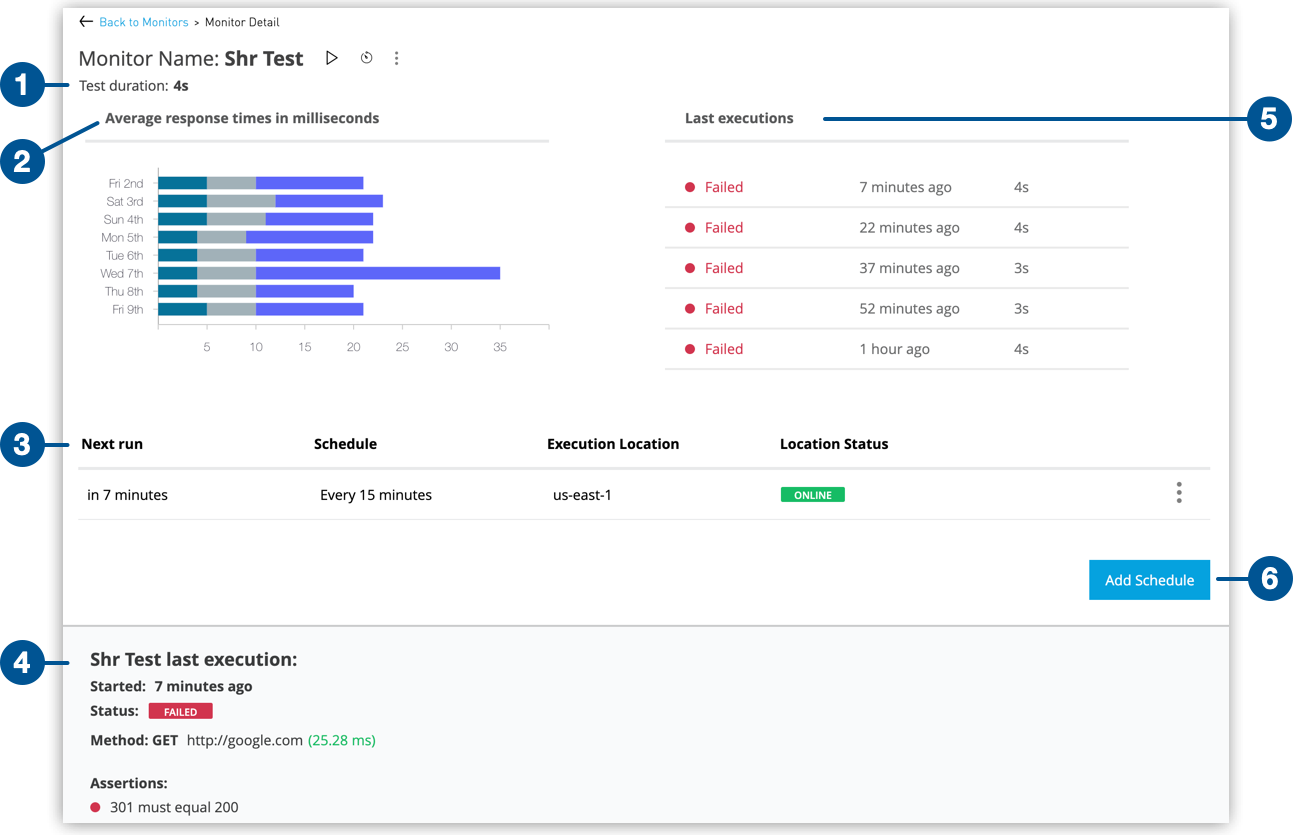
| 1 | Duration of the test for the selected monitor. |
| 2 | Daily average response time in milliseconds of all tests to all endpoints. The colors in each bar indicate the breakdown of the average time for each of the steps in a test. Hover over the bar to see the breakdown details. |
| 3 | Schedule information, including when the next run is scheduled, the schedule interval, and information about the location where the tests are scheduled to run. |
| 4 | Details about the previous execution, including the method executed and the assertions. |
| 5 | A summary list of the last few executions. |
| 6 | Option to add schedules to the selected monitor. |
The bar graph shows the daily average response time in milliseconds of all tests to all endpoints. The colors in each bar indicate the average time for each of the steps in a test. Hover over the bar to see the details.