API Consumer Analytics
You view the metrics associated with the API calls made by your client applications from the Developer portal.
The API metrics include the number of API requests made by the application, the average latency to service a request, the percentage error (blocked) rate of API calls, and a breakdown of API calls by returned status code.
Viewing these metrics helps you manage API traffic, troubleshoot problems, and provide information to API users. For example, to proactively manage your applications, you can compare the API call rate to the SLA and take necessary actions if the API calls hit the SLA limits often. You can isolate performance issues by determining which APIs take longer to service requests. Determining which APIs have a high error rate can help you troubleshoot problems. As an API owner, if you want to charge based on API calls, you can use the API metrics in the consumer dashboard to make API activity visible and transparent to organizations and applications you are billing.
To View API Consumer Analytics
Sign into Anypoint Platform and from API Manager, and choose Developer portal > My applications
The API metrics associated with all APIs called by your application appear, as shown in the following example:
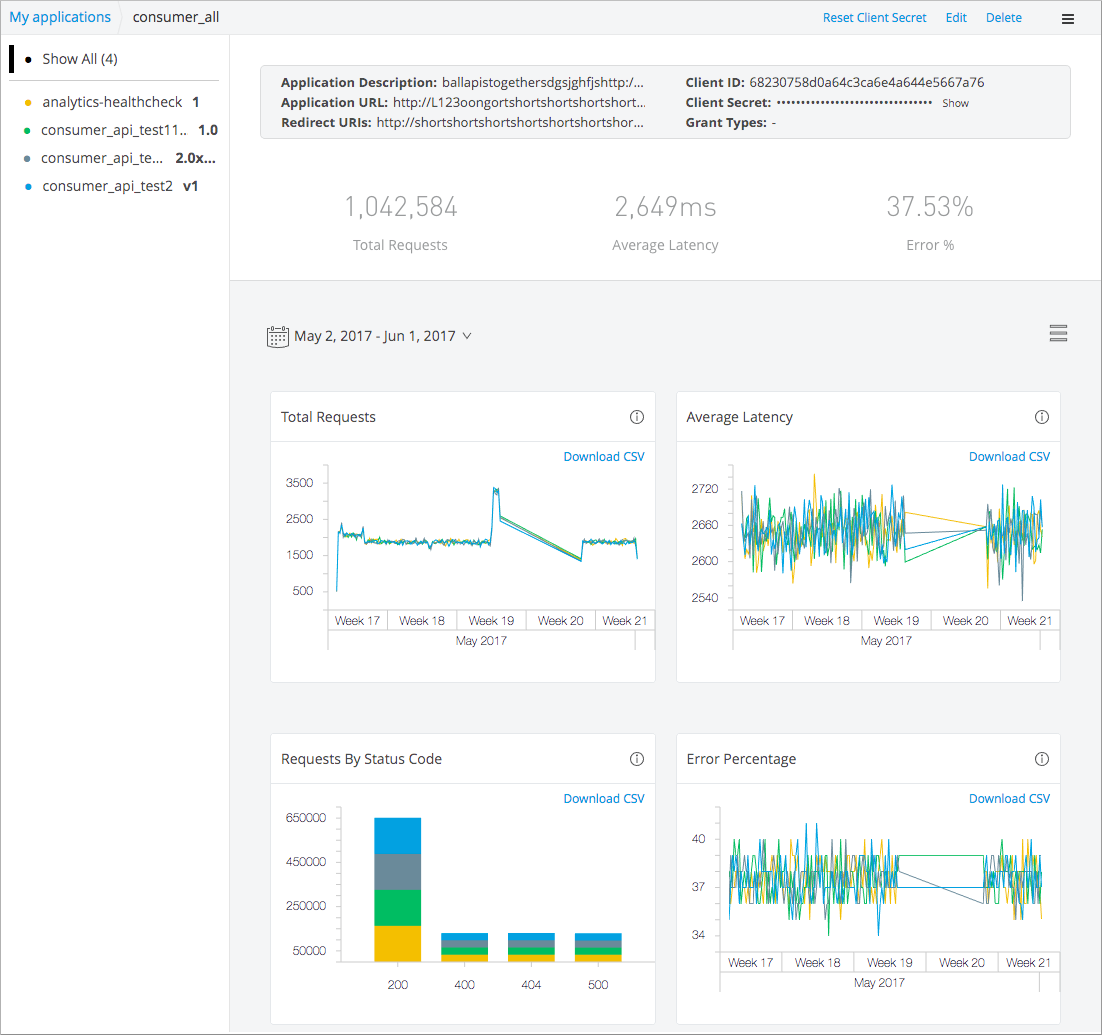
The following metrics appear by default on the dashboard:
-
Number of requests made to an API
-
The average latency to service a request
-
The percentage error rate
-
Breakdown of API calls by status code returned
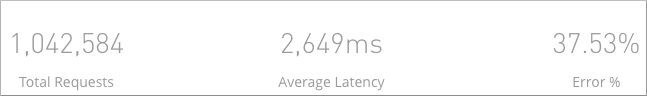
A summary of the total request count, average latency and error percentage for the selected APIs for the chosen time period are computed and displayed above the charts as shown below:
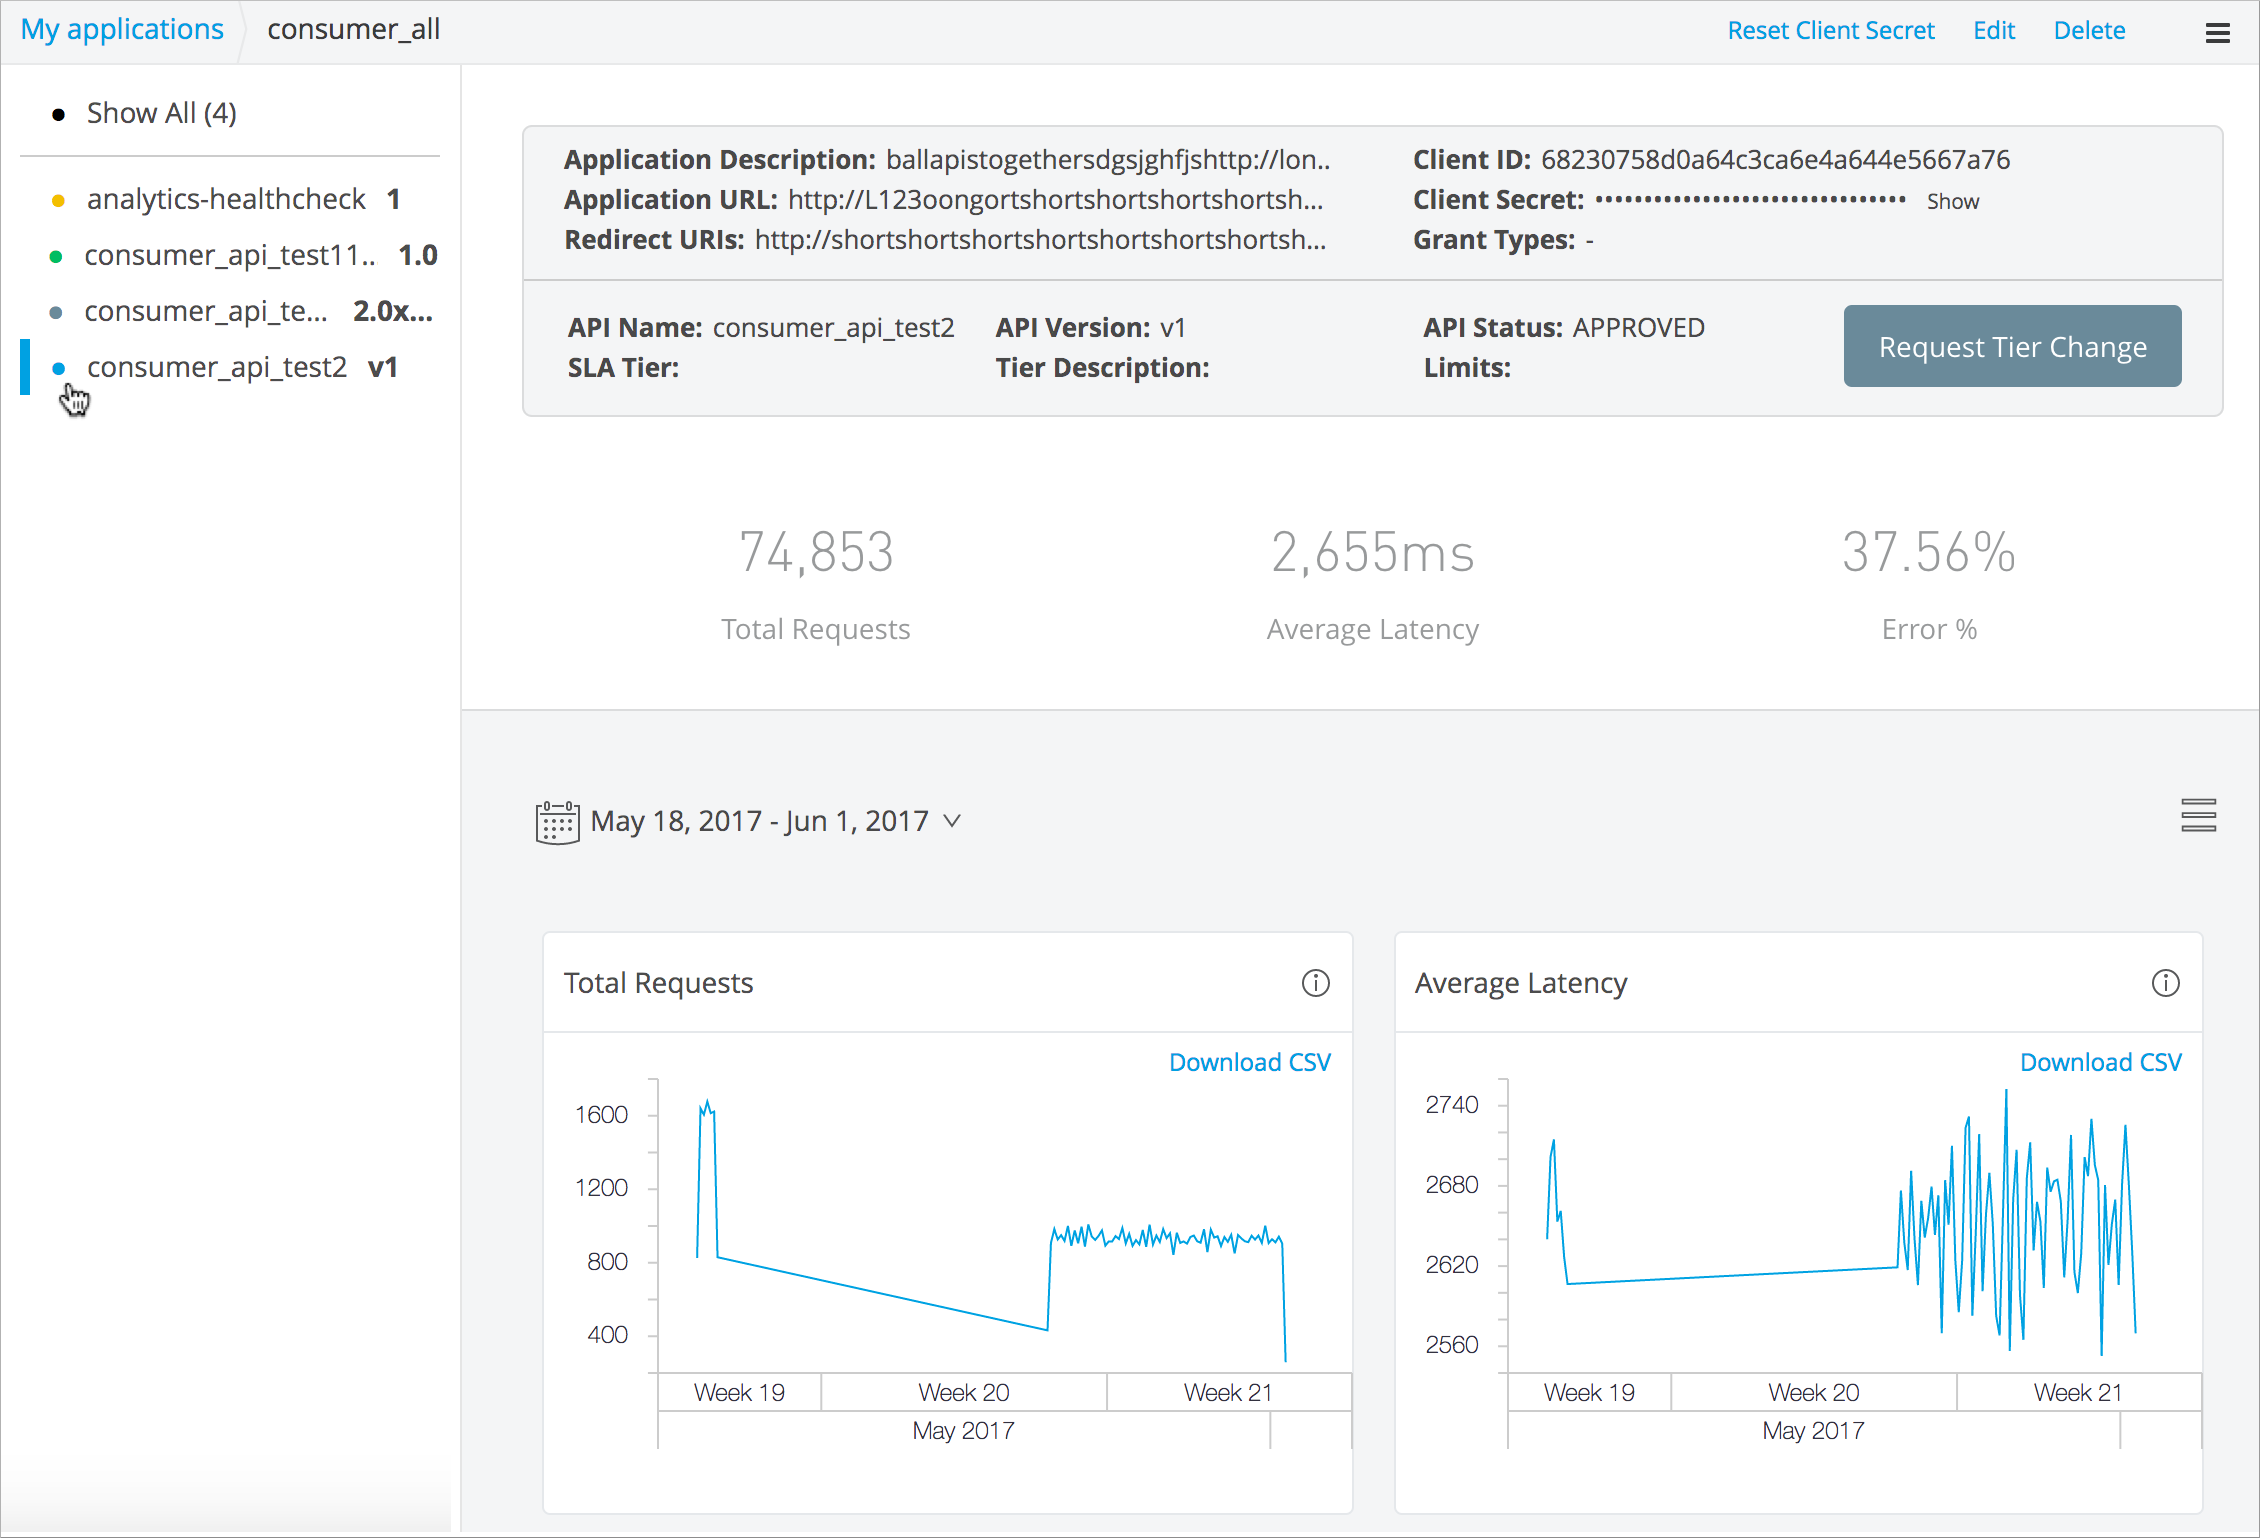
You can selectively view the API metrics, the contract details between the API and the application including the SLA tier, and description and limits by selecting a single API of interest on the left side panel.
You can selectively compare the API metrics by selecting multiple APIs of interest on the left side panel.
You can toggle between list and grid view to the right of date/time picker to view either one or two charts per row.

Consumer Metrics Reference
Graphs of API consumer data show aggregations over the following periods of time: 3 days, 7 days, 14 days, 30 days, 60 days, 90 days and any custom date range.
API Analytics groups metrics into these categories:
-
Number of requests made to an API
-
The average latency in milliseconds to service a request
-
The percentage error rate (computed as a percentage of number of calls that returned 4xx and 5xx out of total API calls placed)
-
Breakdown of API calls by status code returned
All chart datasets can be downloaded in csv format.
API Consumer Analytics Fields
| Field | Description |
|---|---|
Edit |
Edit the information for the current API such as the API name, version, SLA tier, and status. |
Reset Client Secret |
Get a new client secret for the current API. |
Delete Application |
Delete the current application. The interface prompts to ensure you really want to complete this action. |
Application URL |
URL for accessing the application. |
Redirect URIs |
Alternate redirected URL to the API (if any). |
Client ID |
A unique 64-bit identifier for the current API. |
Client Secret |
A unique 64-bit secret value for the current API. |
API Name |
The name of the API. |
API Version |
The version of the API. |
SLA Tier |
The current tier level for your software licensing agreement. |
Status |
Indicates whether or not the SLA tier has been approved by the application’s owner. For more information on SLA tier status, see Defining SLA Tiers and Adding an SLA Tier. |
Request Tier Change |
Button that enables you to request a different SLA tier level. You may consider raising the SLA tier level if the API performance is consistently too low. |
Total Requests |
Indicates the number of requests that occur each duration depending on what duration range you click. |
Average Latency |
Indicates the average latency of the successful requests. It is measured by the how many milliseconds it takes to receive and successfully complete a request. |
Error Percentage |
Indicates how many requests returned an error code of 4xx or 5xx such as 404 and 500. |
Tier |
The current SLA tier for the API. |
Description |
Description of the SLA Tier. |
Limits |
Any limits placed on the API. |