Finance Analysis Basics
In the view Finance Analysis, you record, monitor, and analyze the financial aspects of a Process.
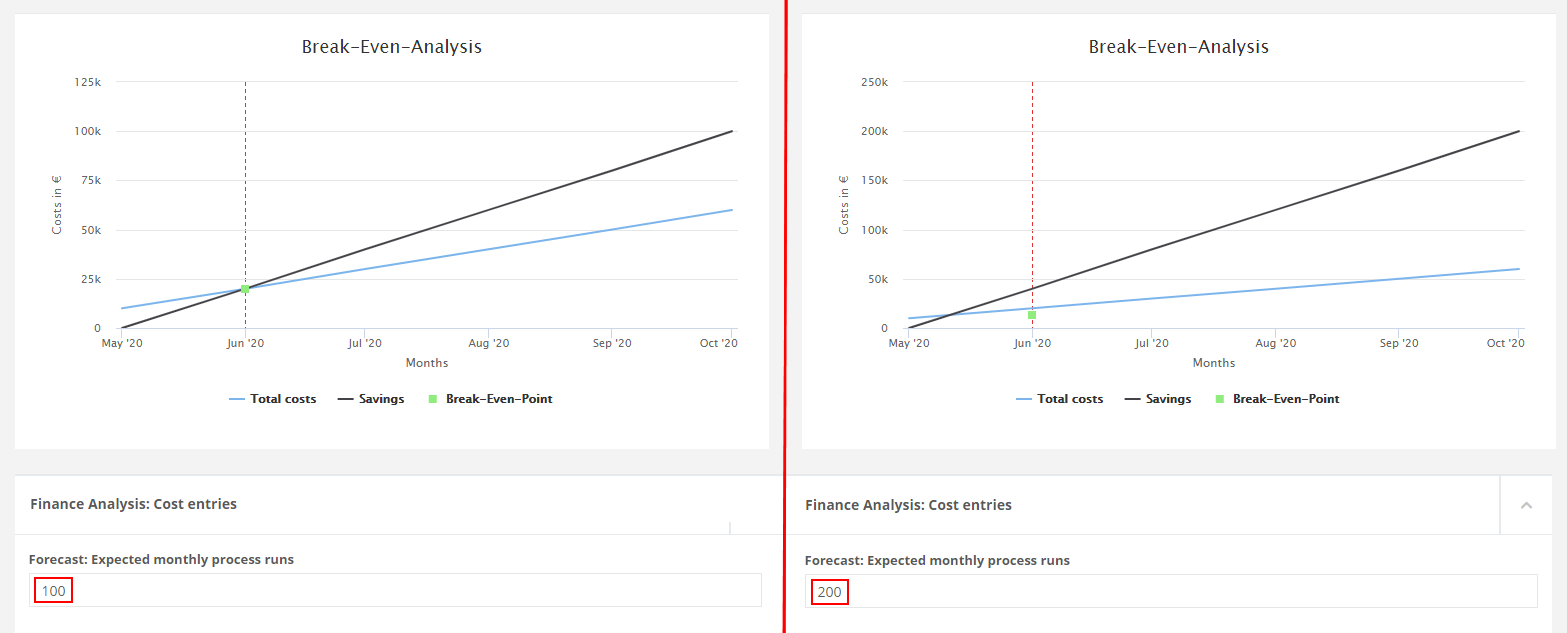
You can enter all expenses for automation of the process. On the basis of the costs of manual execution of the process and the number of process runs already carried out automatically, and the expected future number of monthly process runs, the Net profit per month and the expected Break-Even Point of the process are calculated.
Costs, savings, net profit, and break-even point are shown in line charts from the time of creation of the process. The data is shown from the start of automation within a configurable time period of a maximum of 60 months.
Each change to the raw data is reflected directly in the graphic. This way, you can analyze when the process automation pays for itself.
For the Finance Analysis, you require the following values:
-
Actual and expected number of process runs per month.
-
Costs of a process run if this is carried out by a human (Cost per process run for manual process execution).
-
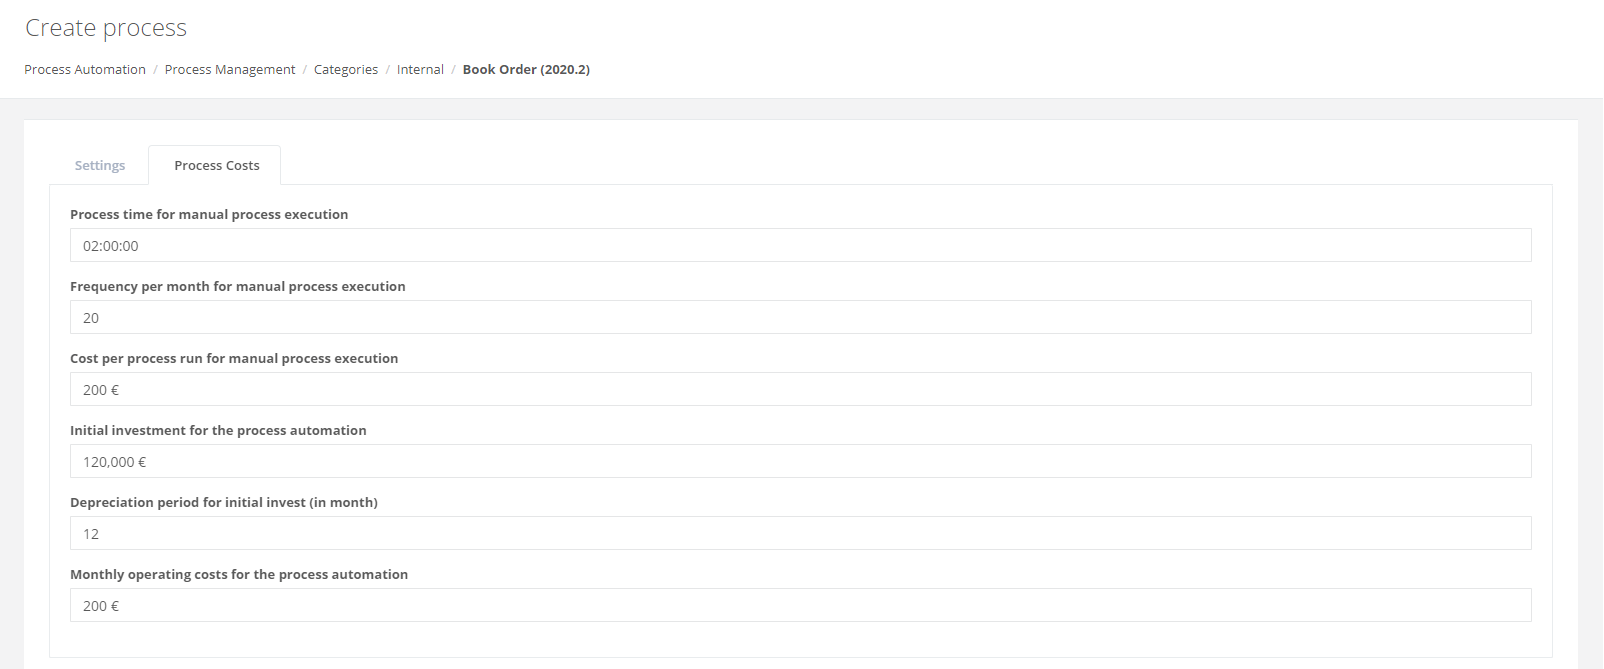
Initial Investment for acquisition of the MuleSoft RPA solution and all other investments.
-
Period in months for depreciation of the initial investment and all other investments (Depreciation period for initial invest (in month)).
-
Monthly operating costs of process automation (Operating costs).
If these details are incomplete or are missing entirely, incorrect values or no values at all (n/a) are displayed in the table.
You can see the overview of all processes in the Processes for finance analysis view and the overview of a single process in the detailed view.
In this topic fictitious data is used. The data is selected to enable interrelationships to be illustrated and it is not based on actual cases.
Raw Data
Process Costs
The Process Costs consist of the Investments in acquisition, set-up, and extension of the MuleSoft RPA solution, spread over the Depreciation period and of the monthly Operating Costs for the use of the MuleSoft RPA solution.
Process costs relate to a full month in each case.
You can enter the costs of manual execution of a process in the evaluation of the process under Costs.
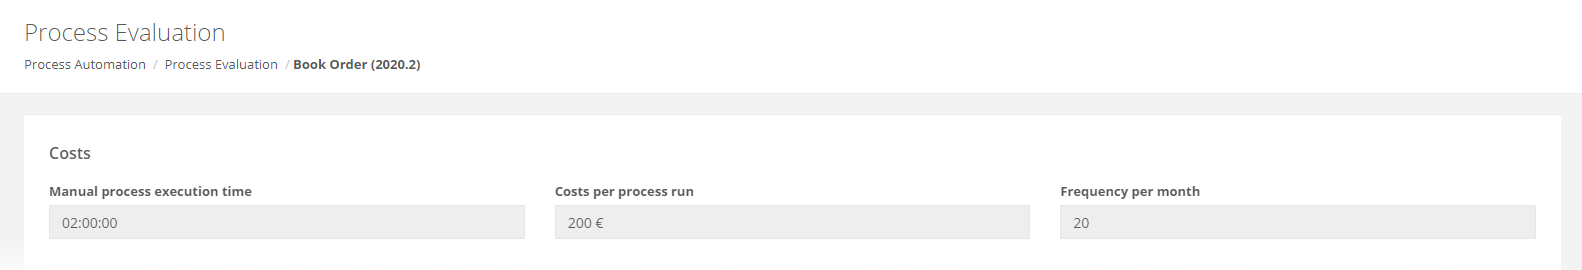
When a project is created for this process, these costs are copied to the project data sheet under Process Costs and can be changed there.
In the Finance Analysis itself, you can adjust the process costs again if required and you can continue to maintain them.
Results Data
The results data is displayed graphically. It is calculated as follows.
Fixed Costs
Monthly Fixed Costs are the total of all depreciation amounts for one month.
The monthly fixed costs can always be calculated in advance as the depreciation period has also been determined in advance.
These costs can increase if new investments are made.
Example: Calculation of the Monthly Fixed Costs
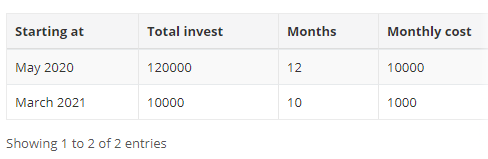
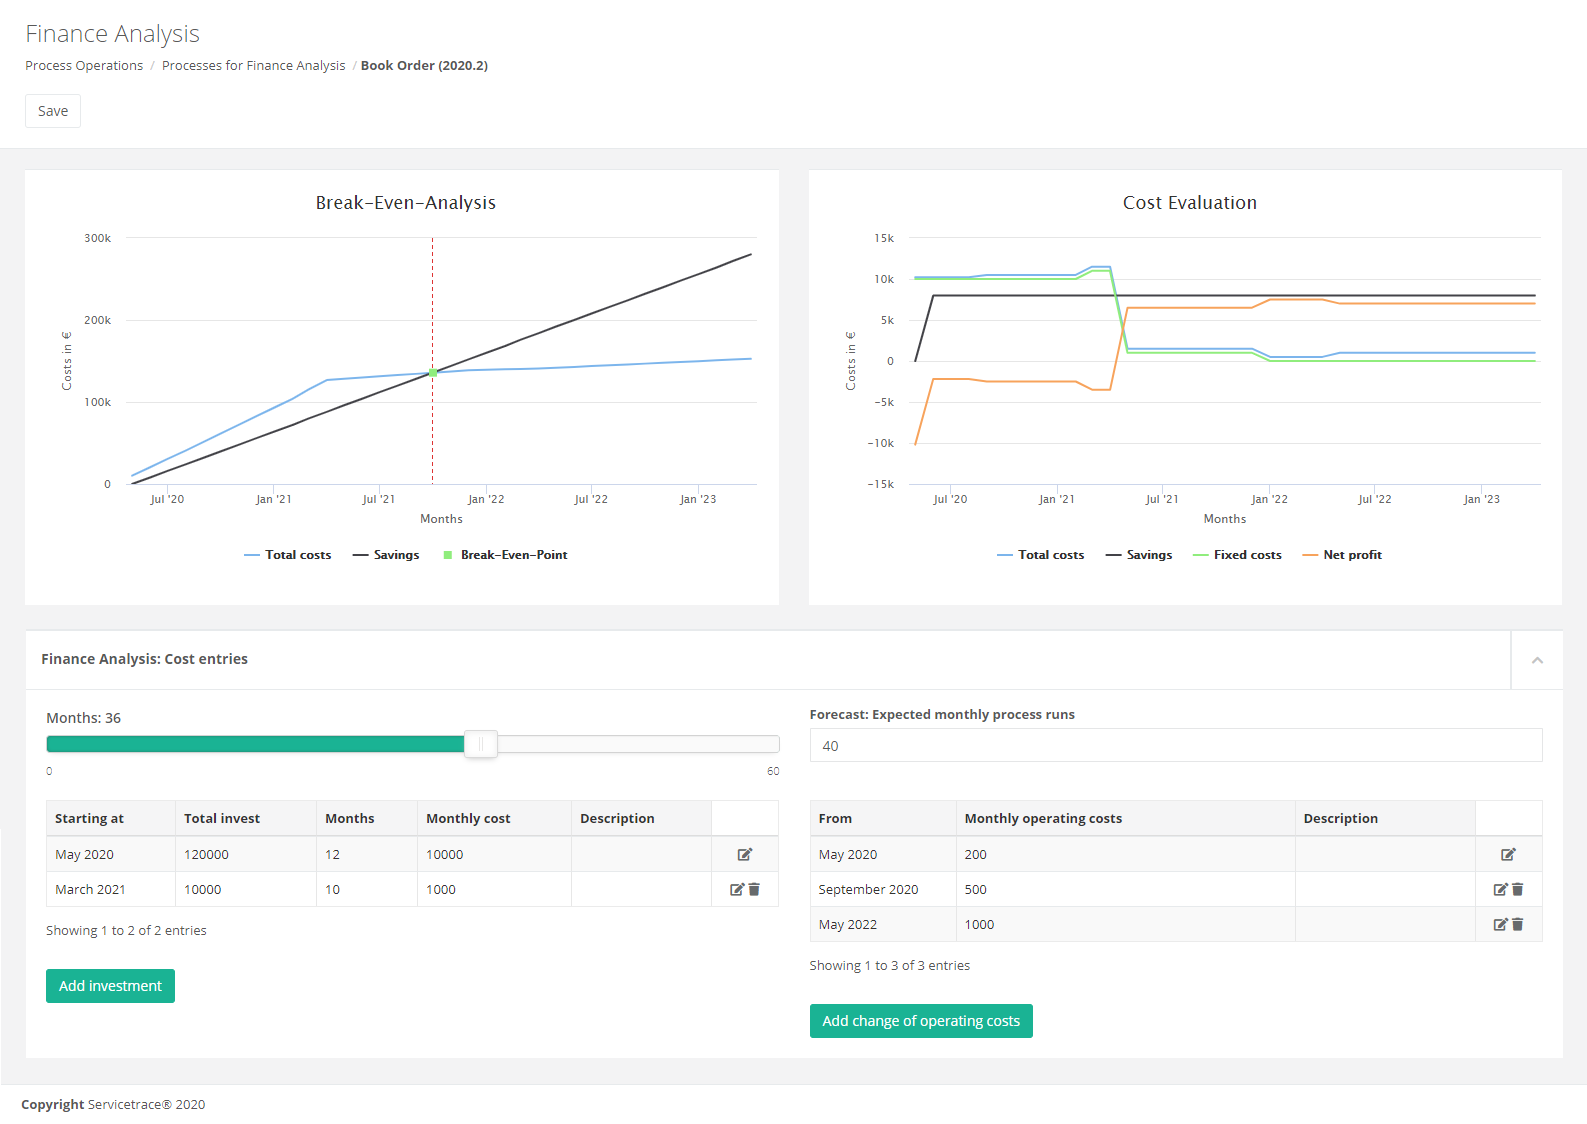
In this example, an initial investment of 120,000 € was made on May 20 to buy the MuleSoft RPA solution and its environment. The specified depreciation period was 12 months. This resulted in a monthly depreciation amount of 10,000 € for the next 12 months.
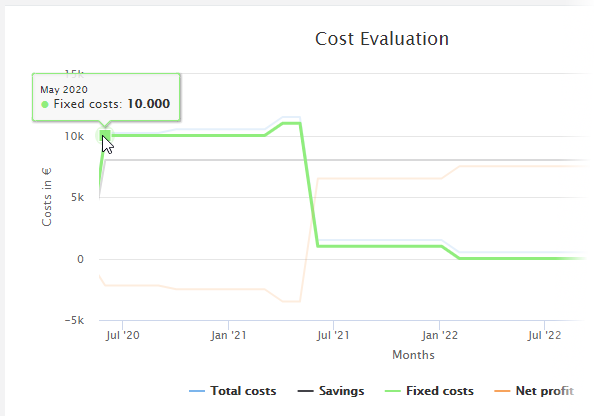
In the Cost Evaluation graphic, you can see this with the horizontal line at 10,000 €.
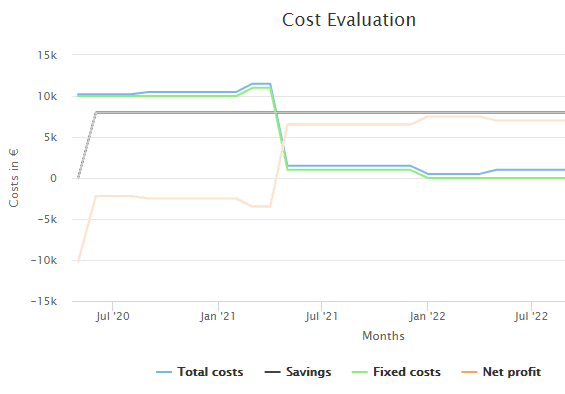
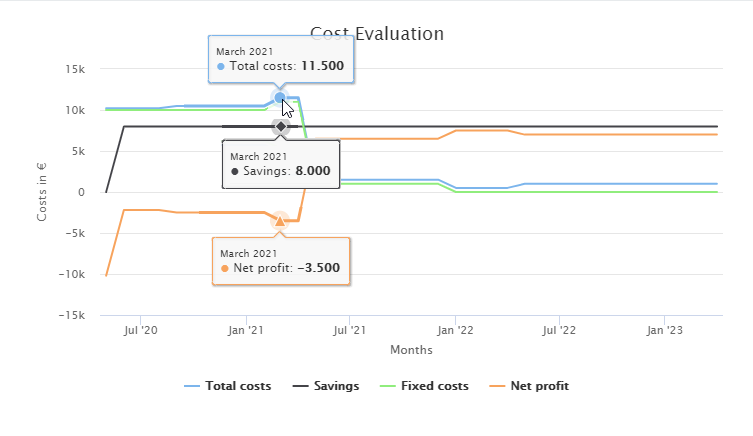
In March 2021, an additional 10,000 € are invested for an extension of the automation. The depreciation period here is 10 months, which results in a monthly depreciation amount of 1000 €.
From March 2021, this amount is added to the total of the monthly fixed costs.
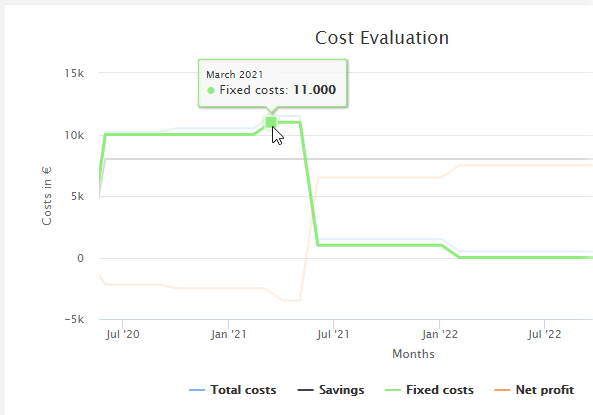
In the Cost Evaluation graphic, this is shown by the fact that the horizontal line rises by 1000 € and is then at 11,000 €.
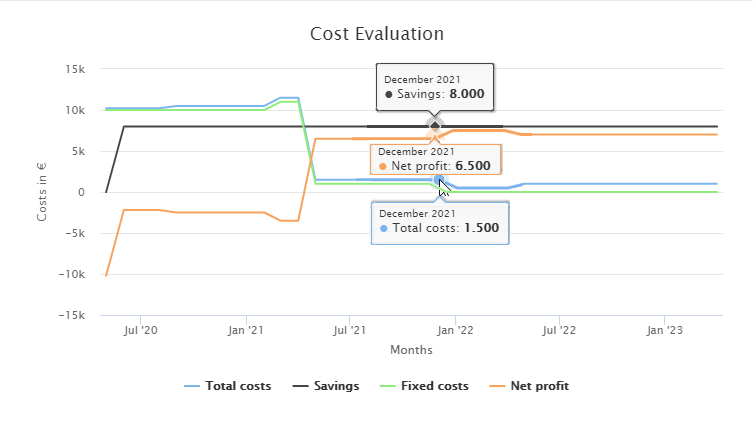
In April 2021, the final part of the initial investment is depreciated. From May 2021, therefore, the monthly fixed costs amount to only 1000 €.
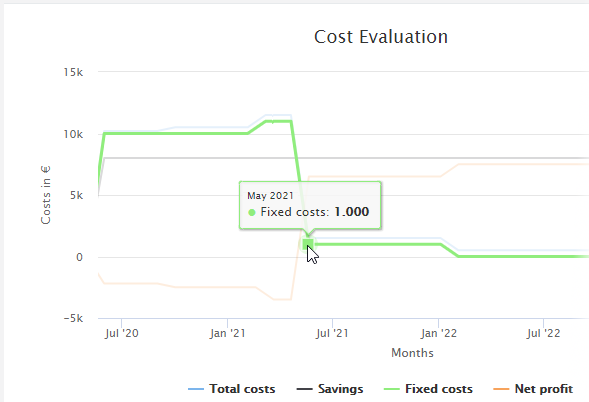
In the Cost Evaluation graphic, this is shown by the fact that the horizontal line falls by 10,000 € and is then at 1,000 €.
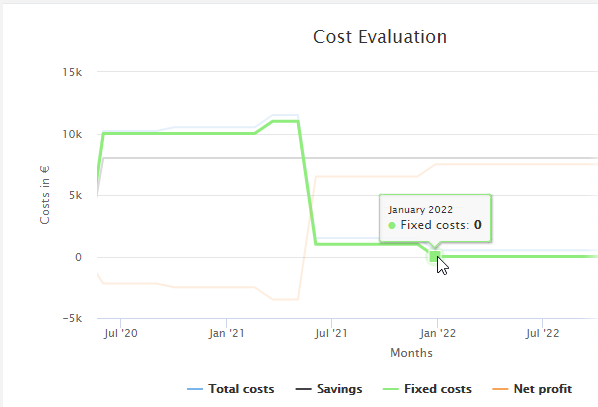
When the final depreciation amounts of the second investment are posted, then, in our example, there are no longer any monthly fixed costs as of January 2022. The horizontal line in the Cost Evaluation graphic continues at 0 until new investments are made.
Operating Costs
The monthly Operating Costs are those costs that are incurred every month in addition to the fixed costs. They include rental costs and salaries, for example.
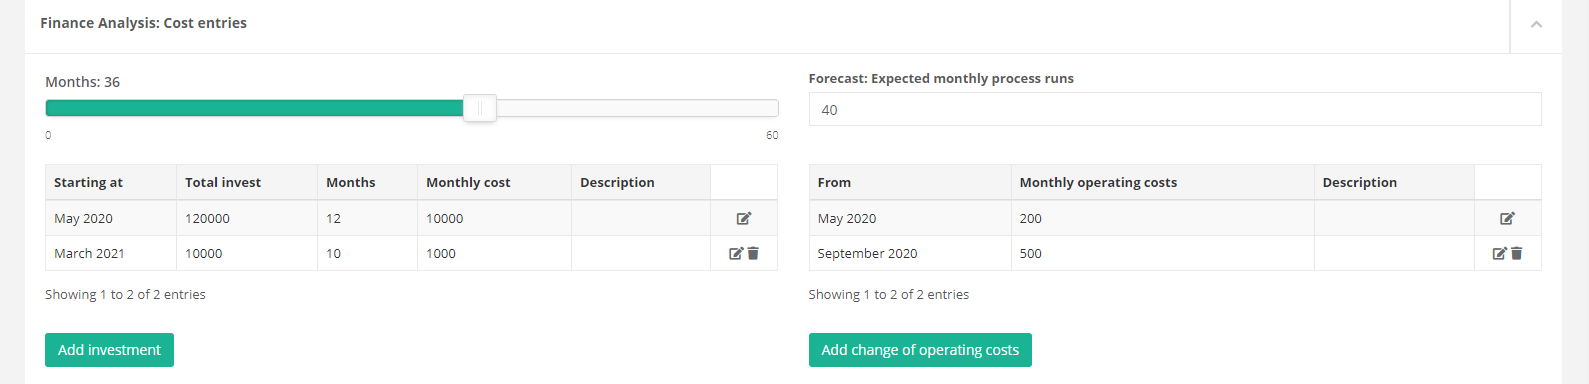
You enter these costs in the Finance Analysis: Cost entries panel in the detailed view of the Finance Analysis.
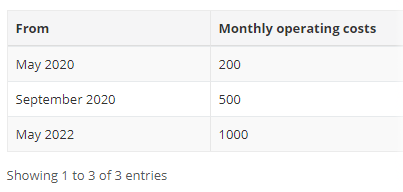
The specified monthly operating costs are in each case the total monthly operating costs from the specified month. The previously entered operating costs are only valid in each case until the previous month of the next entry of operating costs. Therefore, the new operating costs replace the old.
Total Costs
Total monthly costs (Total Costs ) equal the total of the monthly fixed costs and the monthly operating costs.
Example: Calculation of the Total Monthly Costs
The monthly fixed costs and the monthly operating costs are included in the total monthly costs.
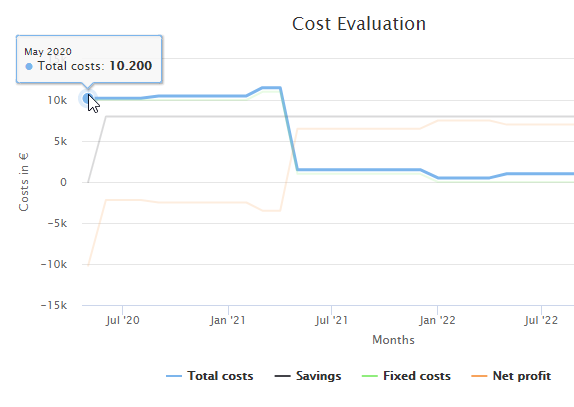
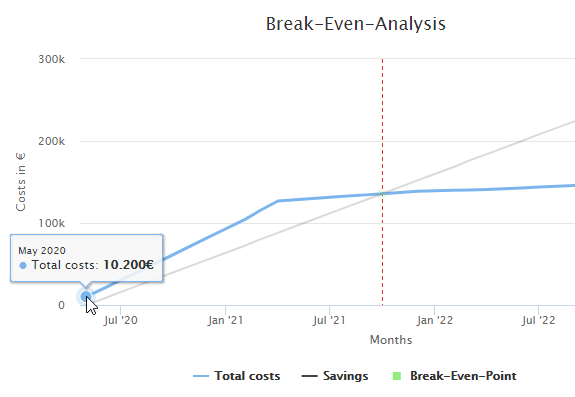
In May 2020, the total monthly costs amount to 10,200 €. This amount is calculated from the depreciation amount of 10,000 € and the monthly operating costs of 200 €.
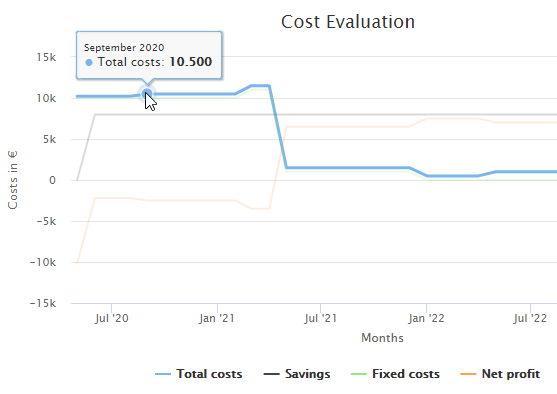
In September 2020, with unchanged fixed costs, the monthly operating costs increase from 200 € to 500 €. The total monthly costs therefore increase to 10,500 €.
From then on, the total monthly costs initially follow the pattern of the fixed costs.
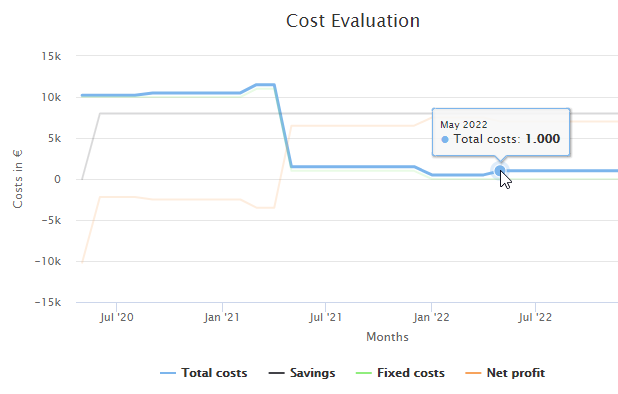
Since the operating costs are doubled in May 2022, the chart continues further above the fixed costs from that date. Since, at this time, all investments are now depreciated, the total costs now equal the operating costs.
Cumulative Total Costs
Cumulative monthly Total Costs equal the total of the cumulative monthly total costs of the previous month and the Total Costs of the current month.
Each month, therefore, the current costs are added to the aggregated costs so far.
Example: Calculation of the Cumulative Monthly Total Costs
Initially, the cumulative total monthly costs equal 10,200 €.
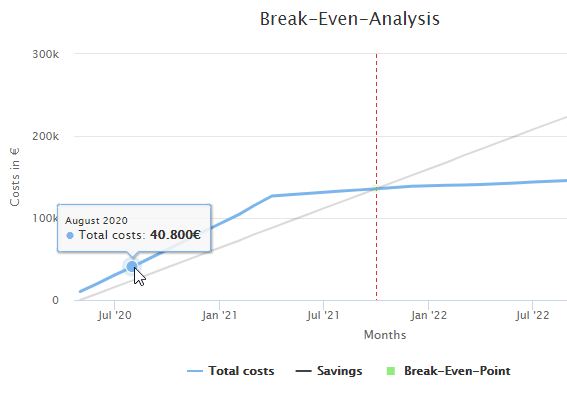
In August 2020, cumulative total costs after 4 months have reached 40,800 €, that is .
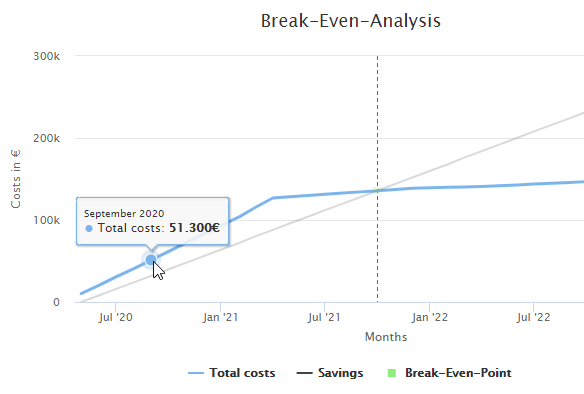
Since, from September 2020, the monthly operating costs increase by 300 €, the cumulative total costs at this point increase to 51,300 € instead of to 51,000 €, that is .
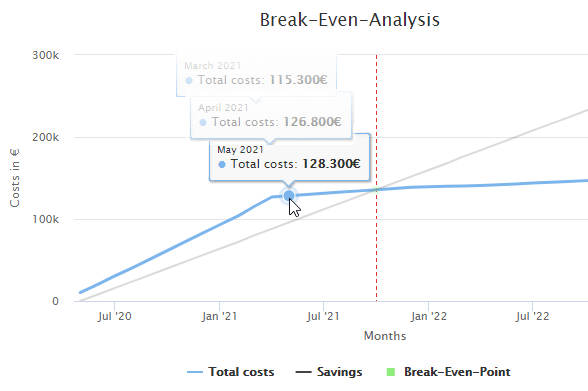
From the month of March 2021, an additional monthly depreciation amount of 1000 € is added to this. The cumulative costs from this point, therefore, increase a little more, that is, to . In April 2021, the final amount of the initial investment is paid. From May 2021, therefore, the cumulative total costs no longer increase so steeply; they now total .
Savings
The monthly Savings achieved through automation are calculated from the total Number of Process Runs successfully carried out in one month by bots multiplied by the costs of the one-time manual execution of the process by a human .
To calculate the savings, the number of actually executed process runs for each full month in the past is used. For the current month and future months, the expected number is used.
Example: Calculation of the Process Runs Actually Carried Out
If you prefer not to read the number of process runs actually carried out indirectly from the chart, but would rather calculate the number yourself, then open the Run results view in the detailed view of the process in Process Management.
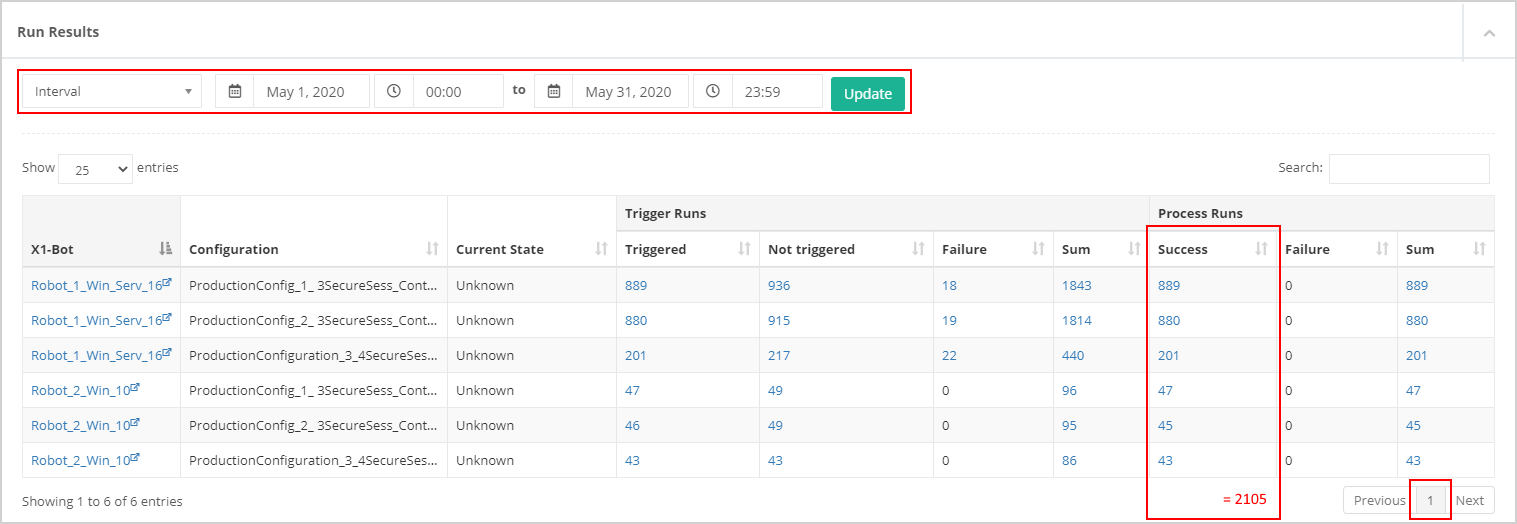
Set the interval at a month and add up all entries from the column Success. If there are more than 100 executions, you must add the numbers from all pages of the table. This number is multiplied by the process costs to calculate the savings for the month.
The data is determined from scratch each time so any change in the process costs leads to a different curve.
Example: Calculation of the Monthly Savings
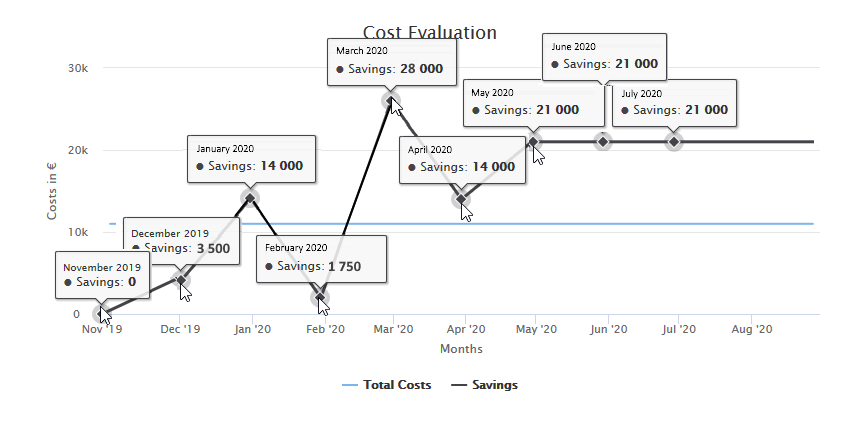
In this example, the costs of the one-time execution of the process by a human are 70 €.
We are now in May 2020.
From the curve, we can see that the process was not carried out in the month of November ( ). In December, the process was carried out fifty times ( ), in January, 200 times ( ), in February, 25 times ( ), in March, 400 times ( ) and in April, 200 times ( ).
The expected number of process executions was set at 300.
Therefore, the savings from this month onwards equal 21,000 € consistently.
As soon as the month of May is complete, the actual number of process executions is used to calculate the savings.
Cumulative Savings
Cumulative monthly Savings equal the total of the cumulative monthly savings of the previous month and the savings of the current month .
Example: Calculation of the Cumulative Monthly Savings
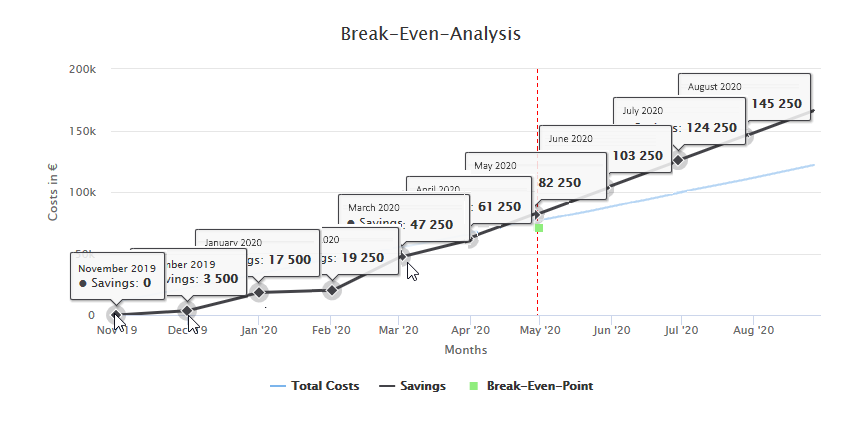
In this example, which was also used in the section Savings, the process was already executed automatically in the months of November through April. Since the execution of the process is dependent on conditions that cannot be influenced - in this case, for example, fluctuations in the number of book orders - the process was executed a different number of times each month. Since the overall trend was increasing, the forecast of future execution frequency was set to a value that reflects this trend. If the forecast is accurate, the savings grow with each month.
To illustrate the situation, the savings achieved each month are added to the cumulative savings of the previous month.
From the curve, we can see that in November, there have not yet been any cost savings. In December, the savings amount to 3,500 €, in January, an additional 14,000 € is saved so that the cumulative savings are now 17,500 € ( ), in February, then 19,250 € ( ), in March, 47,250 € ( ), and in April, 61,250 € ( ).
As of the month of May, a further 21,000 € is added each month so that the curve climbs linearly from then on.
Net Profit
The monthly Net Profit is the result of the savings from automation less the total costs.
Example: Monthly Net Profit
As long as the monthly Total Costs exceed the monthly Savings , the monthly Net Profit is negative.
As soon as the monthly Savings exceed the total monthly costs (Total Costs ), the monthly Net Profit is positive.
For this reason, the curves intersect here in the month of April 2021, when the savings exceed the costs for the first time.
The break-even point is not reached until later as it relates to the cumulative values.
Cumulative Net Profit
The Cumulative Net Profit, , equals the total of the cumulative monthly net profit of the previous month and the net profit of the current month .
The cumulative net profit is not shown in any graphic but it is required for calculation of the Break-Even Point.
Break-Even Point
The Break-Even Point is the first month in which the cumulative net profit is positive - that is, greater than zero.
From this point onwards, automation is profitable.
The Position of the Break-Even Point
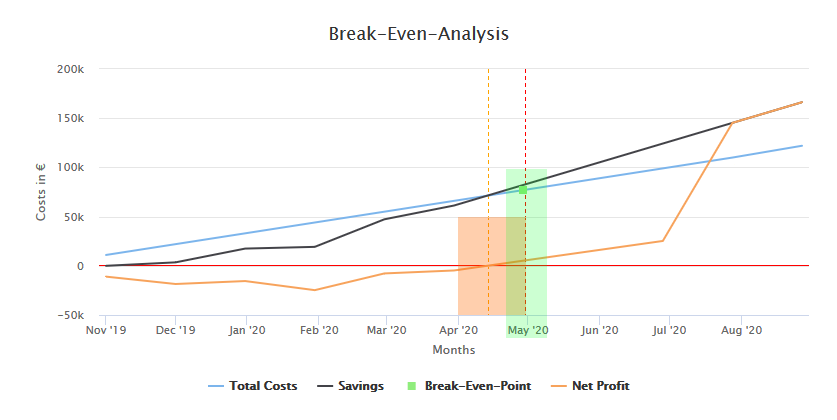
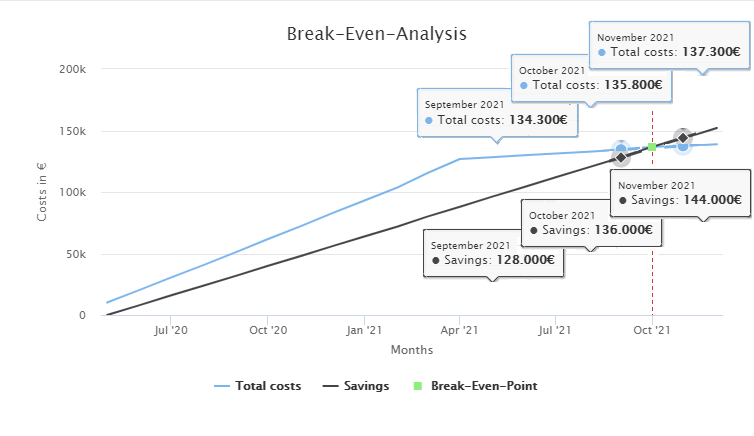
In mathematical terms, the break-even point is the exact point in time when cumulative savings equal cumulative total costs. In the graphic, this time is shown as the orange dotted vertical line.
The red dotted vertical line marks the end of the month in which this equivalence was achieved for the first time.
If the intersection point of both curves is at the start of a month, the break-even point is displayed mathematically correctly; If the intersection is somewhere during the month, the break-even point is displayed at the end of this month.