<PatternLayout pattern="%-5p %d [%t] [processor: %X{processorPath}; event: %X{correlationId}] %c: %m%n"/>
MDC Logging
Mapped Diagnostic Context (MDC) enriches logging and improves tracking by providing more context or information in the logs for the current Mule event.
By default, Mule logs two MDC entries: processor, which shows the location of the current event, and event, which shows the correlation ID of the event.
Mule Tracing module enables you to enhance your logs by adding, removing, and clearing variables from the logging context for a given Mule event. The logging context exists for the entire execution of the corresponding event.
Prerequisites
To use the MDC Logging operations, complete the following tasks:
-
Install the Mule Tracing module in your application.
-
Change the pattern layouts in the
log4j2.xmlfile toMDC.
| You can use MDC Logging with Anypoint Runtime Fabric or CloudHub 2.0. However, if you are using CloudHub 1.0 to deploy your Mule applications, MDC logging isn’t supported. |
Install the Mule Tracing Module
Follow the next steps to install the Mule Tracing module in your application.
-
Open your Mule project in Anypoint Studio.
-
Go to the Mule Palette.
-
Select Search in Exchange, and search for the Mule Tracing module.
-
Select the module and click Add.
-
Click Finish.
Change the Pattern Layouts in the log4j2.xml File
This change instructs Mule to automatically add the MDC context, which includes the correlation ID and the processor path. You can modify the log4j2.xml file of your Mule application or the file of your Mule instance, which is located in /conf/log4j2.xml.
Follow these steps to change the pattern layouts to MDC:
-
Open the
log4j2.xmlfile for editing. -
Replace
[processor: %X{processorPath}; event: %X{correlationId}]with[%MDC].
Example log4j2.xml File Configurations
<PatternLayout pattern="%-5p %d [%t] [%MDC] %c: %m%n"/>
Available Operations
| XML Element | Description | Accepted Attributes | ||||||
|---|---|---|---|---|---|---|---|---|
|
Sets a logging variable and its value. |
|
||||||
|
Removes a logging variable. |
|
||||||
|
Removes all the logging variables. This option doesn’t remove the processor path or the correlation ID. |
None |
Configure MDC Logging in Your Application
To configure MDC logging, add any of the available operations to your Mule application flow and specify the corresponding attributes.
For example, to configure a logging variable, insert the <tracing:set-logging-variable> XML element into your application flow:
<flow name="exampleFlow">
    ...
    <tracing:set-logging-variable variableName="testVar" value="testValue" />
    ...
</flow>
After executing the flow, the output logs are:
INFO 2021-04-08 16:58:26,882 [[MuleRuntime].uber.15: [test-project-app].exampleFlow.CPU_LITE @18f679] [{correlationId=c85e16c0-98a4-11eb-bc34-cac765a2219b, processorPath=exampleFlow/processors/2, testVar=testValue}] org.mule.runtime.core.internal.processor.LoggerMessageProcessor: Example
This logging context affects any output of a Logger component and any internal logging that Mule runtime produces. Therefore, you can add more context to the event that Mule is processing if you need additional information for tracking down any potential issue, for example, when an unexpected error occurs.
Example
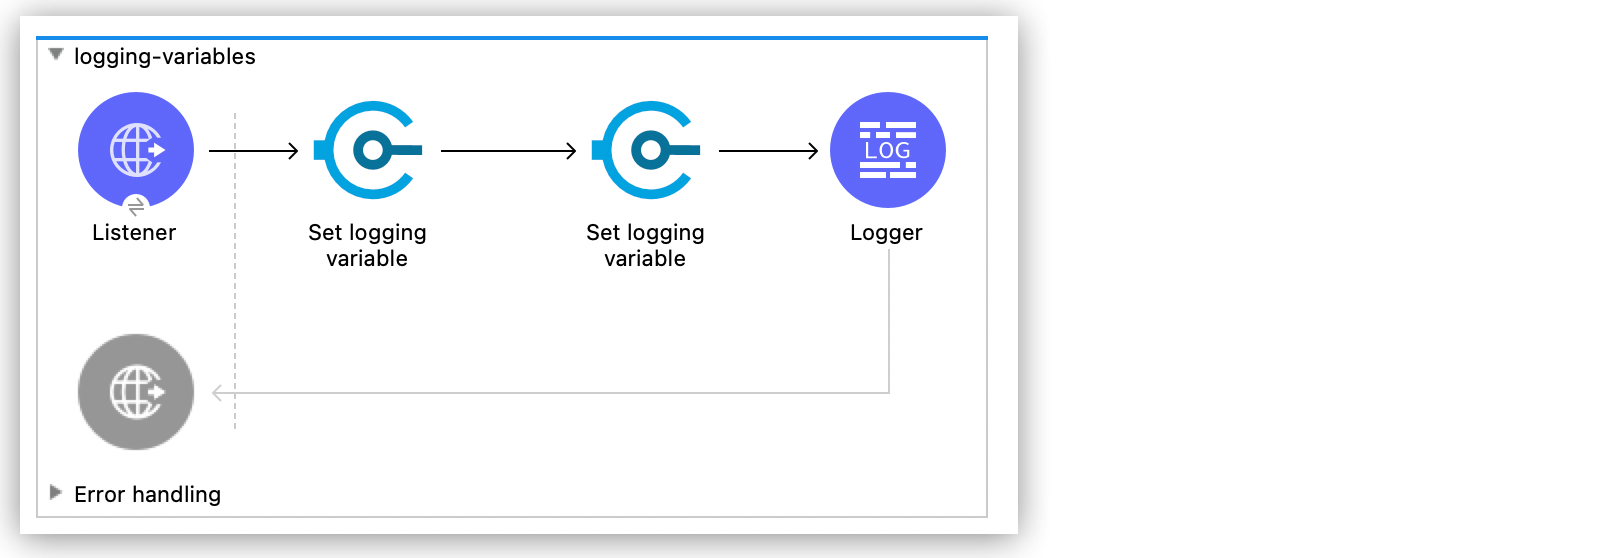
Consider the following application:

<flow name="logging-variables">
    <http:listener config-ref="HTTP_Listener_config" path="/order"/>
    <tracing:set-logging-variable variableName="customerId" value="#[payload.customerId]"/>
    <tracing:set-logging-variable variableName="requestPath" value='#["$(attributes.method):$(attributes.requestPath)"]'/>
    <logger level="INFO" message="#[output application/json --- payload]" />
</flow>
After sending the following request:
curl --location --request GET '0.0.0.0:8081/order' \
--header 'Content-Type: application/json' \
--data-raw '{
    "orderId": 548102842,
    "customerId": "ARG-12934",
    "items": [
        "CP-123",
        "CP-452"
    ]
}'
The output log is:
INFO  2021-04-09 11:14:38,409 [[MuleRuntime].uber.05: [tracing-module].tracing-moduleFlow.CPU_LITE @34a62707] [processor: tracing-moduleFlow/processors/2; event: eb2b2461-993d-11eb-8a64-4865ee1fd814] {correlationId=eb2b2461-993d-11eb-8a64-4865ee1fd814, customerId=ARG-12934, processorPath=tracing-moduleFlow/processors/2, requestPath=GET:/order} org.mule.runtime.core.internal.processor.LoggerMessageProcessor: {
    "orderId": 548102842,
    "customerId": "ARG-12934",
    "items": [
        "CP-123",
        "CP-452"
    ]
}


