Flow Metrics
| MuleSoft deprecated the flow metrics feature on Dec 9th, 2019. We recommend that you use Anypoint Monitoring to monitor your applications and APIs. |
You can view the evolution of performance metrics for individual flows in your applications that are deployed to servers on premises (hybrid or Anypoint Platform Private Cloud Edition).
Enable Flow Metrics for Hybrid
When you deploy a new application to a hybrid deployment environment, the flow metrics feature is not enabled by default. To enable flow metrics, your account must be granted one of the following permissions.
-
Manage Application Data
-
Create Applications
-
Manage Settings
To enable flow metrics:
-
From Runtime Manager, click Applications.
-
Select the application where you want to enable flow metrics, then click Manage Application.
-
Click Settings, then select the Flow Monitoring tab.
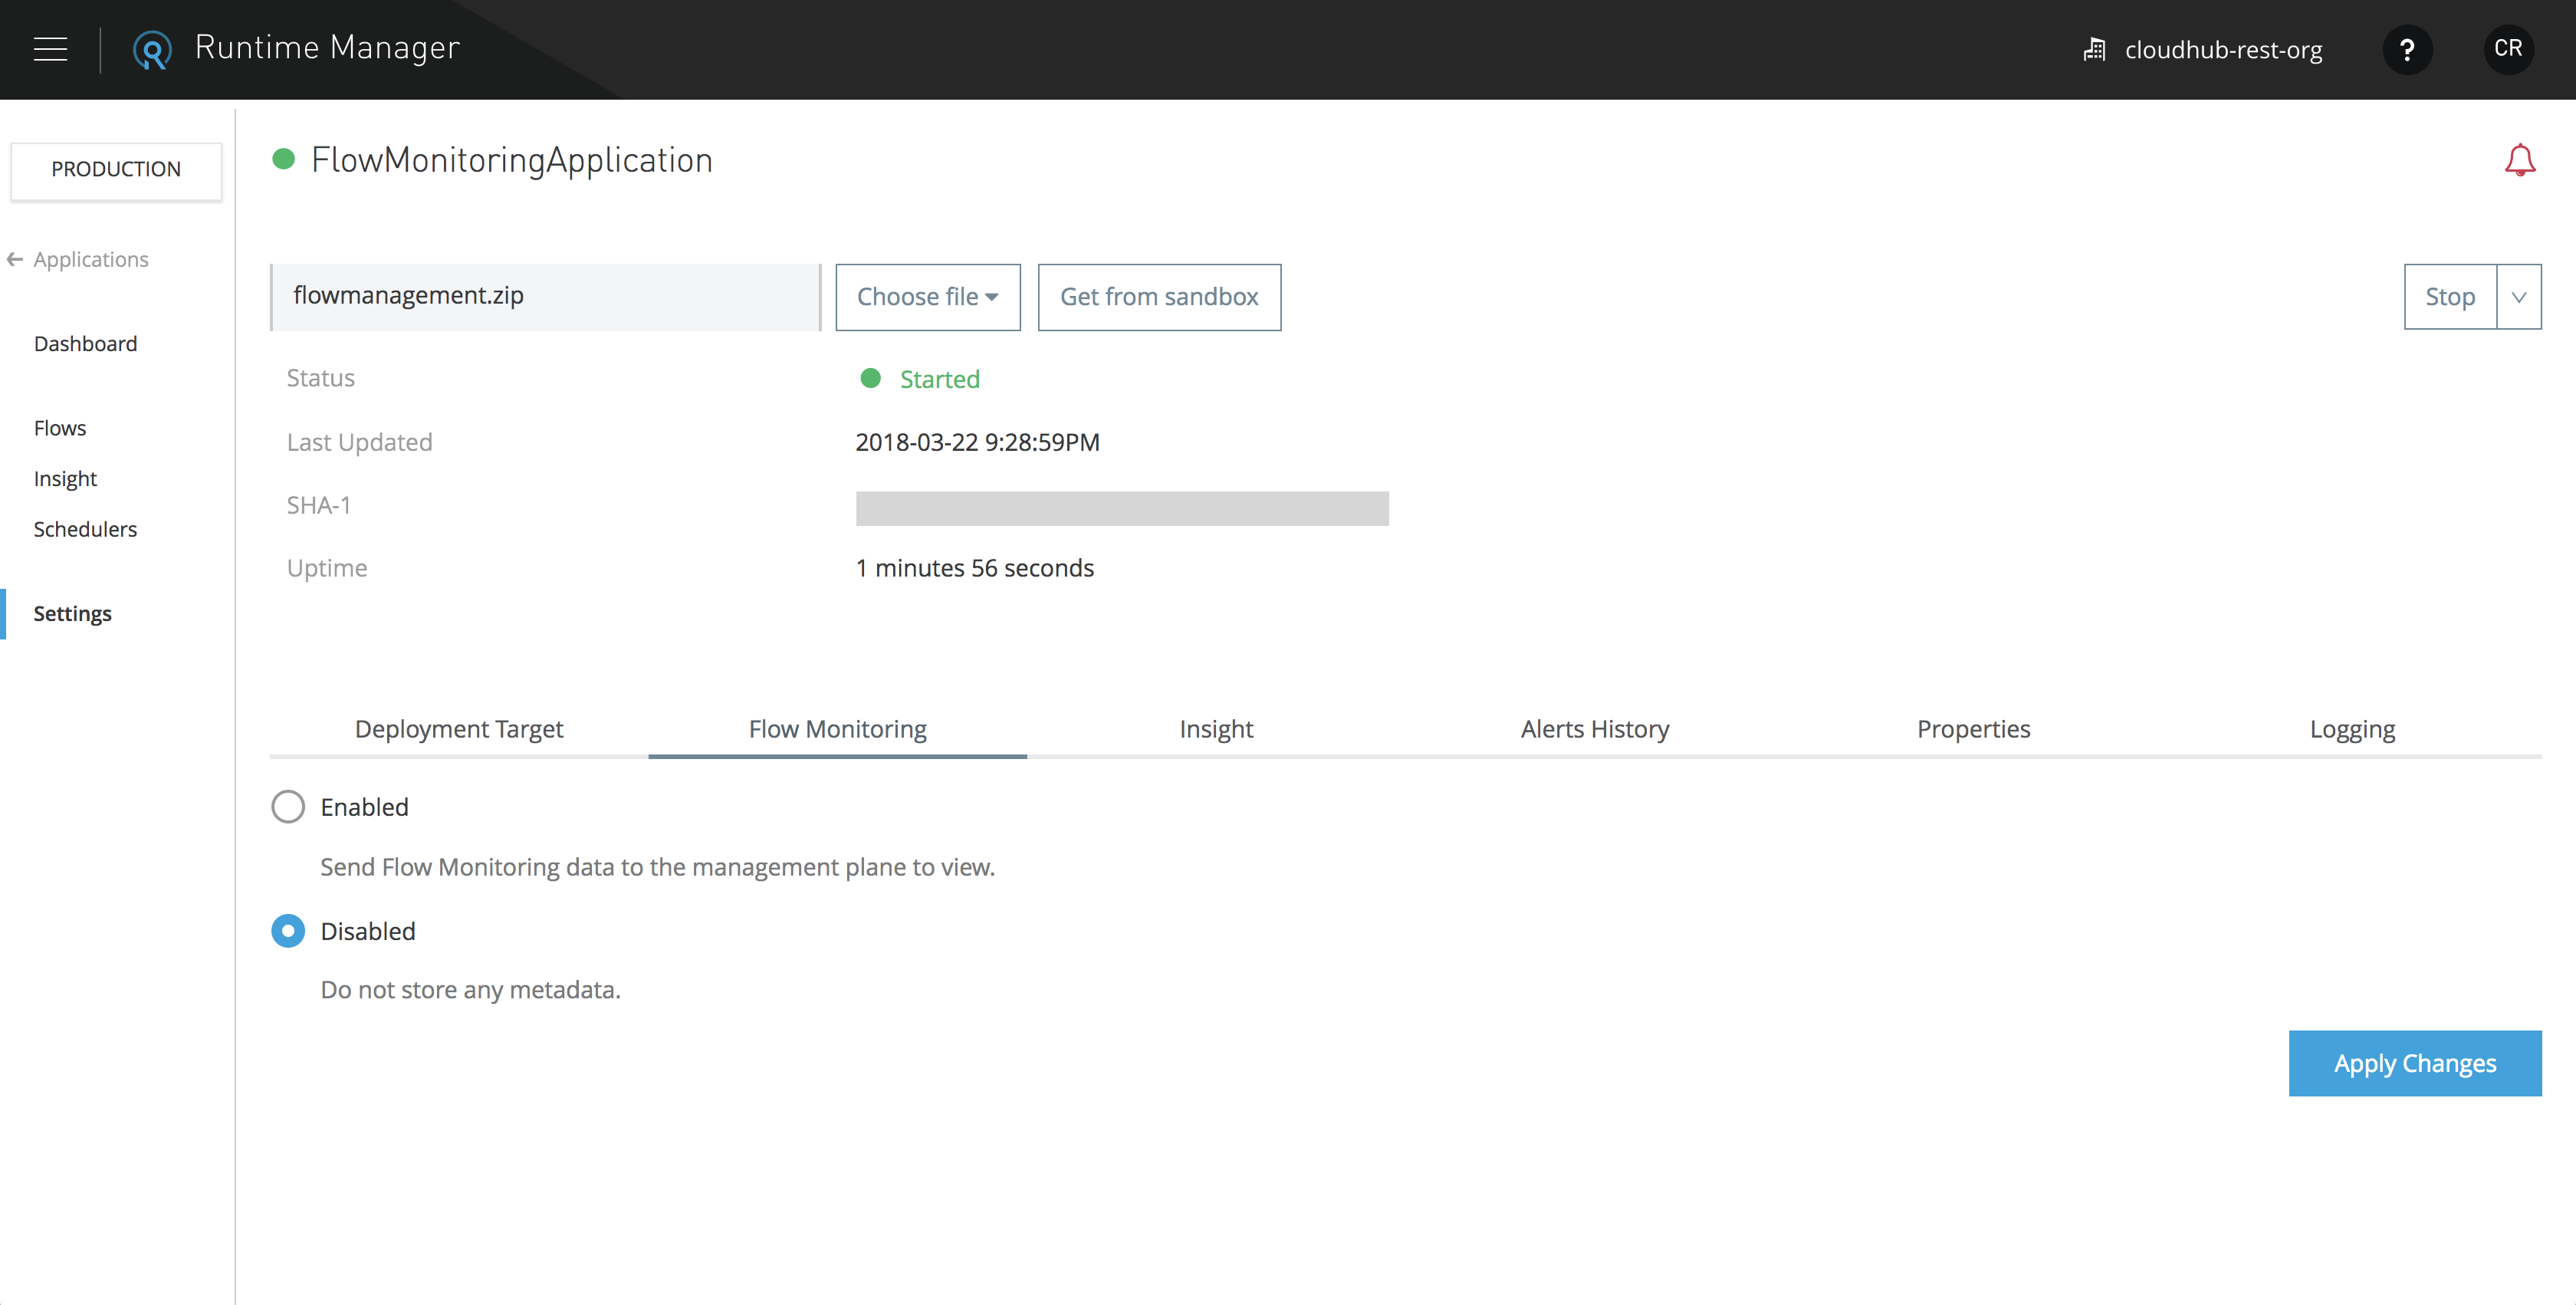
-
Select Enabled.
-
Click Apply Changes.
Access Flow Metrics
To view flow metrics, you must have the Read Application permission for the desired applications.
-
Select the Applications tab in Runtime Manager.
-
Enter a running application’s settings (either by clicking the Manage Application button on the side panel, or the application name itself in the table).
-
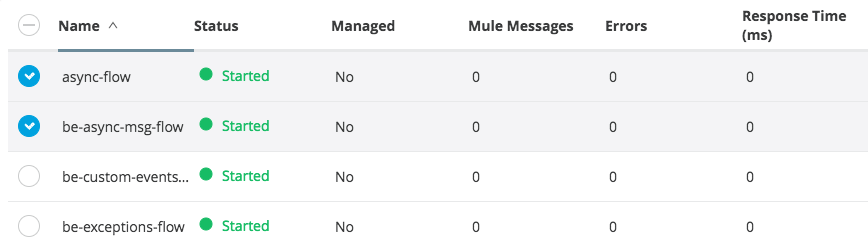
Select the Flows tab on the left side bar.
-
Select one or multiple flows.
Verify the Status of Servers
If your application is deployed to a cluster or a server group, you can view the status of the flow on each server it runs in.
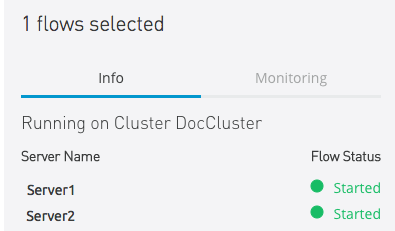
Use this information to rule out the possibility of a communication issue leading to inconsistent states throughout the servers.
View Flow Metrics
Once you have selected one or multiple flows, you can view the Metrics tab.
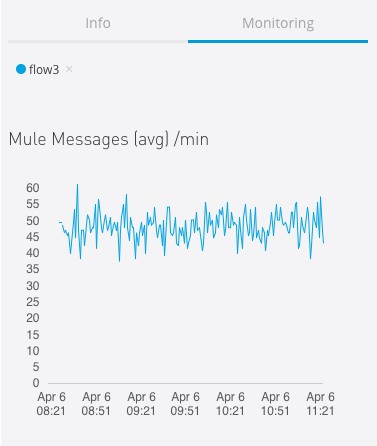
This tab contains charts for the following three metrics:
-
Mule messages
-
Errors
-
Flow response time
All metrics are displayed as an average relative to the selected time scale.
| The retention period for flow metrics is two weeks. |
Navigate the Metrics
All graphs can be viewed at different time scales by selecting the desired time interval on the top-right corner.

If your application runs on a cluster or server group, the aggregated metrics of the entire set of servers included are charted as a single plot line.
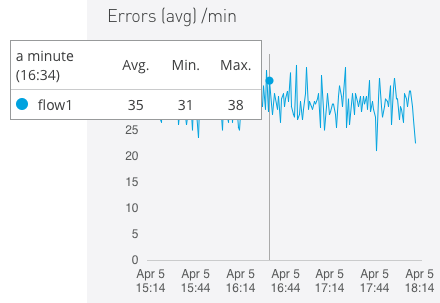
By hovering your mouse over a given point of a graph, an overlay displays numerical detail about activity on that instant.
You can set up alerts to notify you automatically whenever any of these metrics hits a critical value for a sustained period of time.