Insight (To be Deprecated)
Insight is a troubleshooting tool that provides in-depth visibility into business transactions and events on your Mule apps deployed to CloudHub and on-premises servers. Insight tracks everything your data does in an app so you can find and recover from errors that occur during message processing.
Replay is not supported for free or trial user accounts.
|
Enabling Insight can significantly impact data processing performance and memory consumption. For this reason, do not enable Insight for long periods for production environments. Use Insight only for troubleshooting specific transactions by searching for a transaction ID or a unique text string. For information about tools to use for monitoring a production environment, see Monitor Applications and Servers. |
The Insight dashboard enables you to view events that occur within the flows that handle your business transactions. You can drill down into event-related data to analyze the root cause of failures, isolate performance bottlenecks, and test for compliance with company procedures.
Insight helps you answer questions about your integrated apps, such as:
-
What happened with a particular transaction or synchronization?
-
When did the transaction occur? How long did it take?
-
What was the result of a transaction?
-
If something went wrong during processing, at what point did the failure occur?
After you enable Insight, the following items are tracked by default:
-
Data passing through endpoints (inbound and outbound) in your Mule applications
-
Flow initiation and completion
-
Custom business events that you embed in your Mule flows
Limits and Limitations
The following limits and limitations apply when using Insight:
-
Insight drops events over the following limits:
-
A single application is limited to 50,000 events per minute.
-
All applications in a single business group are limited to 100,000 events per minute.
-
-
Insight stores no more than 20 custom event definitions per application definition.
-
Insight does not support long-running processes that contain more than 10,000 events in a single transaction.
For this reason, Insight might not provide visibility into batch processing. See Batch Processing.
-
Insight does not preserve replay data when switching regions.
Ensure that this limitation doesn’t violate your compliance requirements.
-
Logs for applications deployed to on-premises servers contain event information but not message contents.
-
Insight returns consistent results only when searching for terms that are an exact match.
Because Insight limits the number of terms that are included in a query, it might not find all matches when searching for a pattern.
To work around this limitation, either:
-
Search for an exact transaction ID.
-
Tag transactions with custom business events, and then search for transactions based on the custom business events. See Set Up Business Events.
-
Data Persistence
Insight does not limit the size of transactions. Insight displays all transactions in your application for 30 days and keeps events for two days.
Payload Transformation
The following MIME types are always mapped as Strings:
application/javascript
application/json
application/csv
application/rtf
application/vnd.mozilla.xul+xml
application/x-csh
application/x-sh
application/xml
application/xml+html
images/svg+xml
text/calendar
text/css
text/csv
text/html
text/plain
text/xml
For all other types, Mule agent attempts to transform payloads to another format, based on the Stream type that Mule runtime engine exposes to the Mule agent.
For example, Mule agent converts CURSOR_STREAM_PROVIDER payloads to a byte array.
Any streams that are not mapped to String by default appear in the logs.
Enable or Disable Insight
To enable Insight to track the events your Mule servers generate:
-
Sign in to your Anypoint Platform account.
-
Click Runtime Manager.
-
Click Applications in the menu on the left, and click the application in the Name column to open the management panel on the right side of the page.
-
In the management panel, click Insight.
-
Click Settings in the menu on the left, and then click the Insight tab:
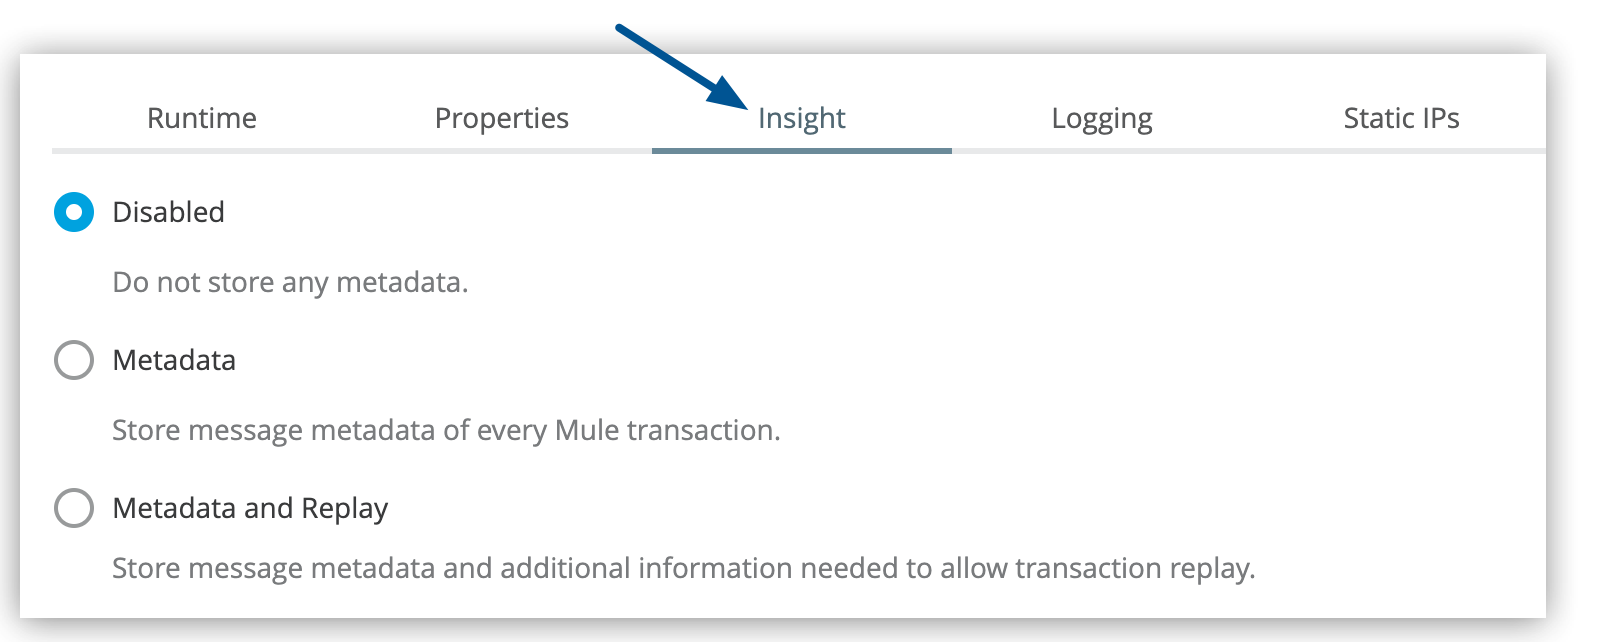 Figure 1. The arrow shows the Insight tab on the Settings page.
 -
Select one of the tracking options:
-
Disabled to disable Insight
-
Metadata to track only events
-
Metadata and Replay to track events and enable the ability to instantly replay a transaction from the console
The Metadata and Replay option is unavailable for free or trial user accounts.
For more information, see Diagnose Problems and Replay Transactions.
-
-
Select the checkbox to confirm that you want to enable Insight, and click Apply Changes.
-
Click Apply Changes to save the application settings.
Search and Filter Transactions and Events
The Insight dashboard displays information at three tracking levels:
-
Transactions
Logical groupings of related events that often correspond to a business view of the system
-
Events
Low-level details of a transaction
Events map to message processors and endpoints and reveal information about exceptions and any custom business events you might have configured.
-
Metadata
Customized key-value pairs that you specify as part of custom events in your application
The detail that Insight tracks at this level provides information about high-level business events.
The following image shows where to find transactions, events, and metadata on the Insight dashboard:
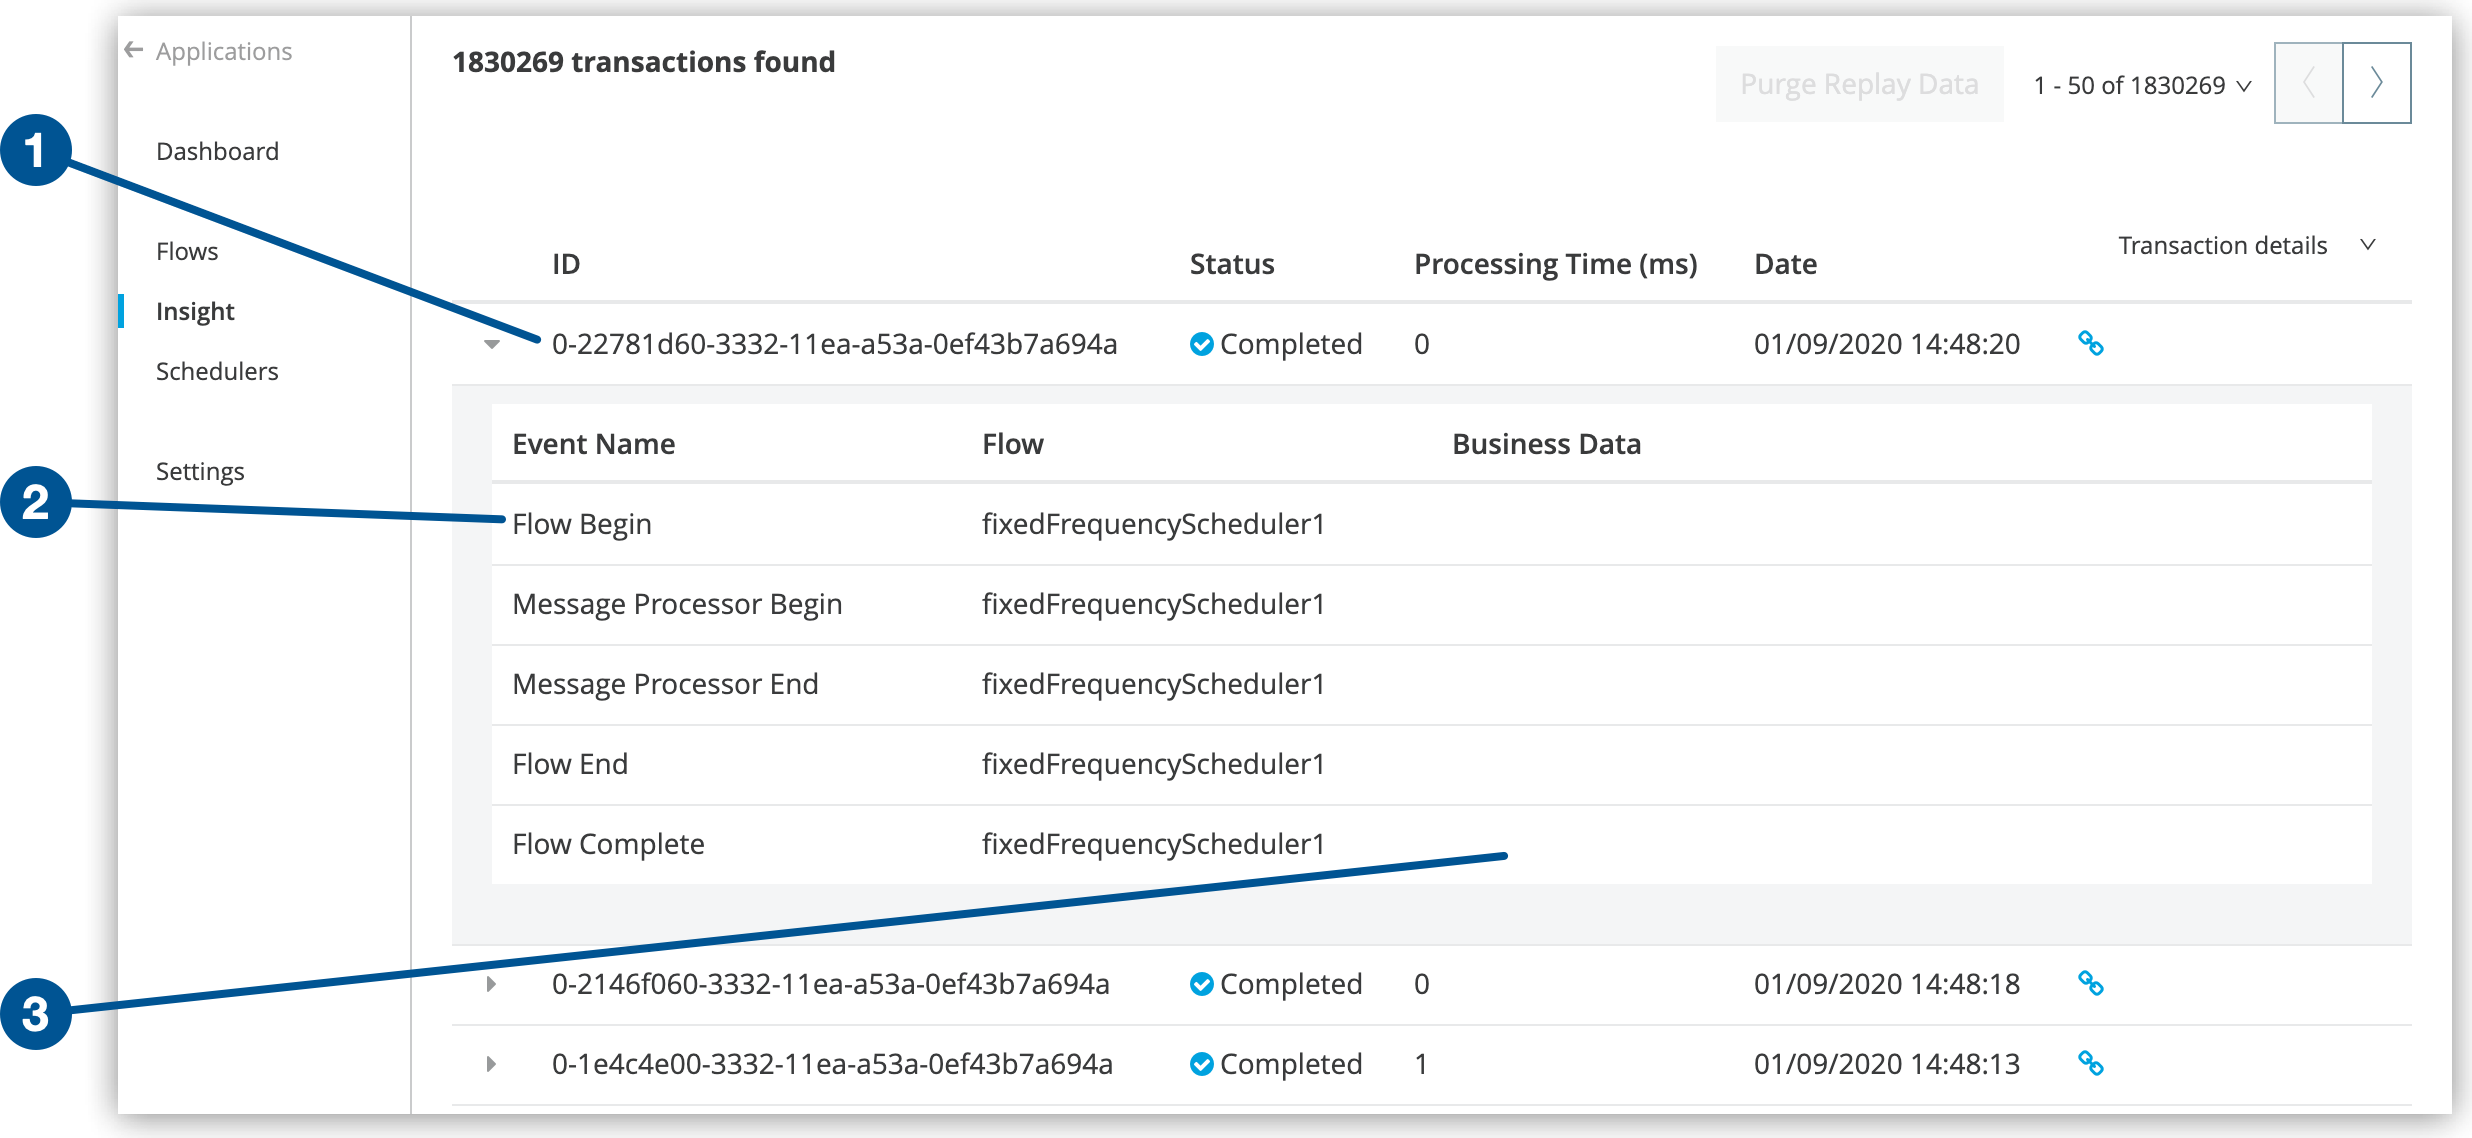
Business data, if configured, appears in the Metadata area (3) of the dashboard. See Set Up Business Events.
Search or Filter Transactions
On the Insight page, you can search or filter data to refine the results displayed. You can search for:
-
A specific transaction by transaction ID
-
Transactions within a specific date range
-
Transactions according to exact flow name, exact exception message, processing time, and any custom business data
To enable the Business Data field your app must have business events configured. See Set Up Business Events.
To search or filter transactions:
-
Click Insight in the menu on the left.
-
Enter your search criteria in the Search field.
-
Click Advanced in the Search field.
-
Specify filter options:
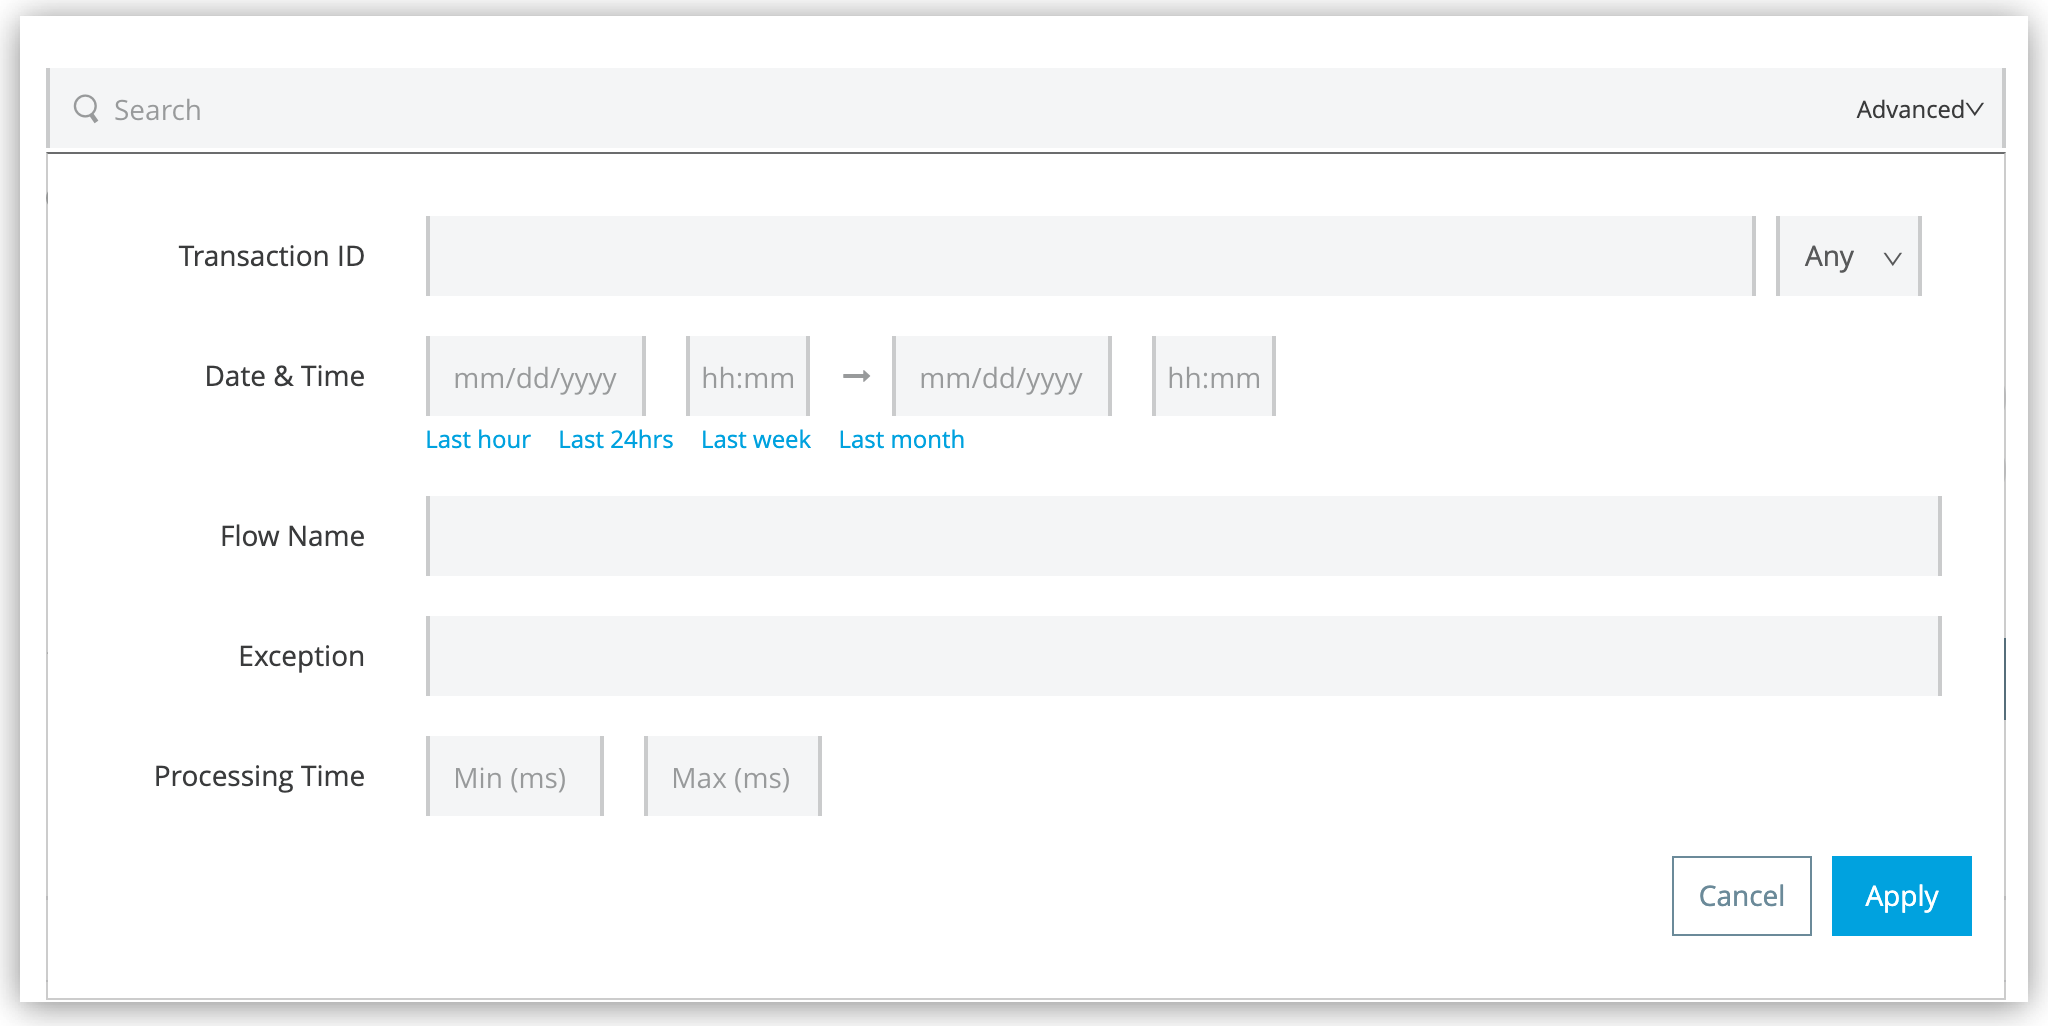 Figure 3. The screenshot shows the advanced search filter fields on the Insight dashboard.
-
To display only failed or completed transactions, select Failed or Completed from the menu in the Transaction ID field:
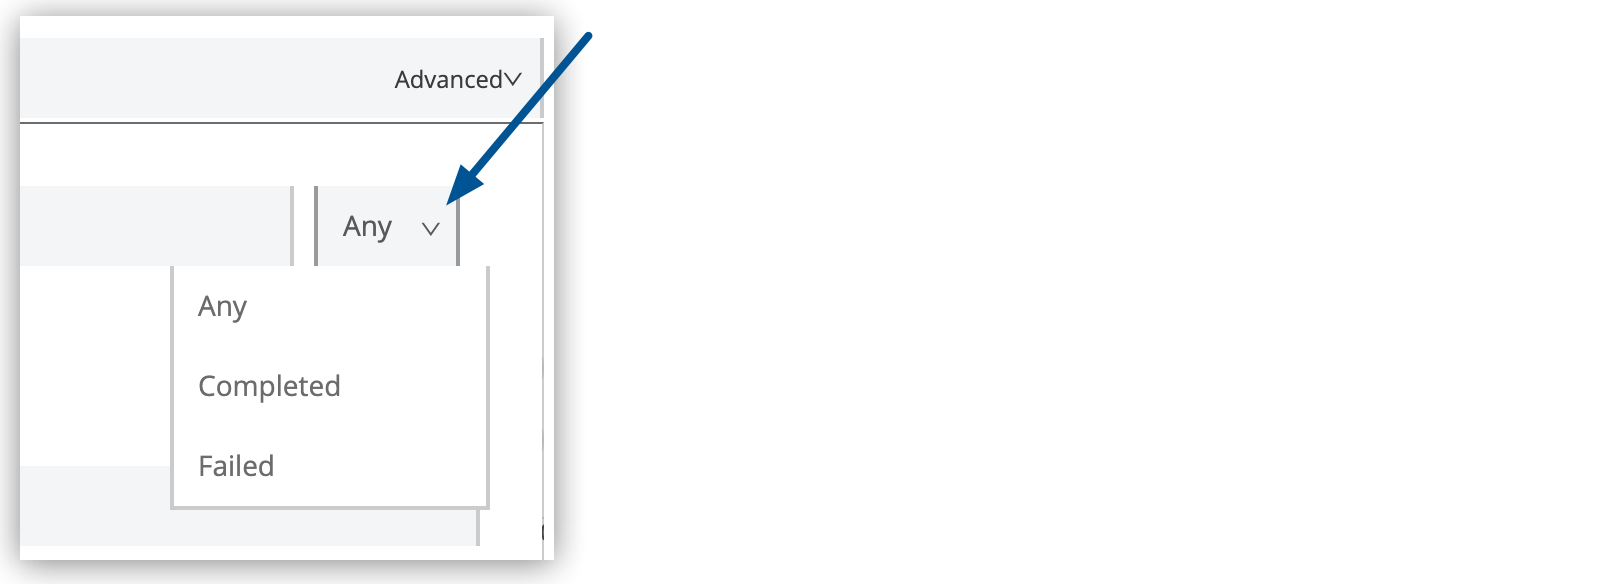 Figure 4. The arrow shows the menu in the Transaction ID field.
 -
To display transactions within a specific date range, specify a date or range in the Date & Time fields.
Alternatively, drag within the graph to select a specific date range:
 Figure 5. The arrow shows the selected transaction range on the Insight dashboard.
-
-
Click Apply on the Advanced pane to apply your search criteria.
-
If you want to save a search, click Save search:
 Figure 6. The arrow shows the Save search icon on the Insight dashboard.
Runtime Manager saves the search to the name you specify.
After you save a search, you can:
-
Run a saved search by clicking the search name.
-
Edit a saved search by hovering over the search name and click the Edit link:
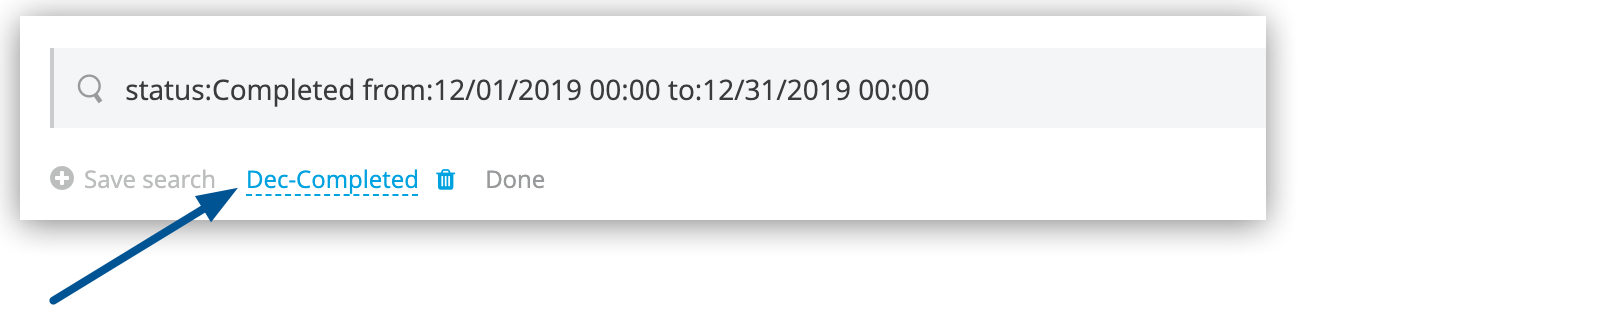 Figure 7. The arrow shows the saved search being edited.
Click Done to save your changes.
-
Delete a saved search by clicking the Edit link, and then clicking the delete icon (trash can) to the right of the search name.
Filter Events
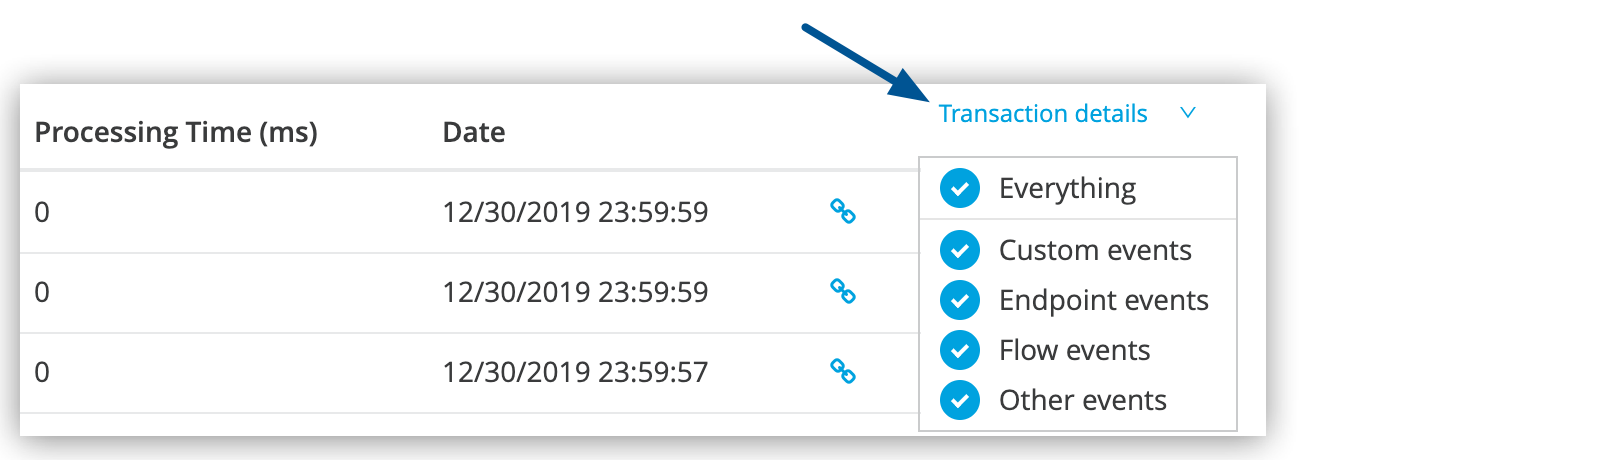
You can refine the types of events that Insight displays for each transaction.
When debugging, you might find it useful to see all events so that you can drill down into the detailed steps of your flow. If you want to analyze higher-level business information, you can apply a filter to view only your custom business events.
To display the filter options, click the Transaction details menu for a transaction:
The default settings of the events filter depend upon your user role:
-
Support
The default events filter setting displays only custom events.
-
Admin or Developer
The default events filter setting displays custom events, endpoint events, and message processor events, but does not display flow events.
Diagnose Problems and Replay Transactions
When Insight reports a failed transaction, you can diagnose the problem and fix the root issue.
Transaction Failed Status
For example, when a transaction fails because an application exceeds the limited number of API calls for a Salesforce account, Insight displays the status of the transaction as Failed.
Click to expand the transaction, and then examine the individual events within that transaction. The exception and the error message are listed next to the failed event, as well as an existing stack trace:

Replay Transaction
![]()
After investigating the logs and resolving the issue (for example, by purchasing more API capacity) that caused the transaction failure, you can replay the transaction.
Replay is not available for free or trial user accounts.
-
Click the replay transaction icon
 to the right of the first event in the failed transaction to replay it:
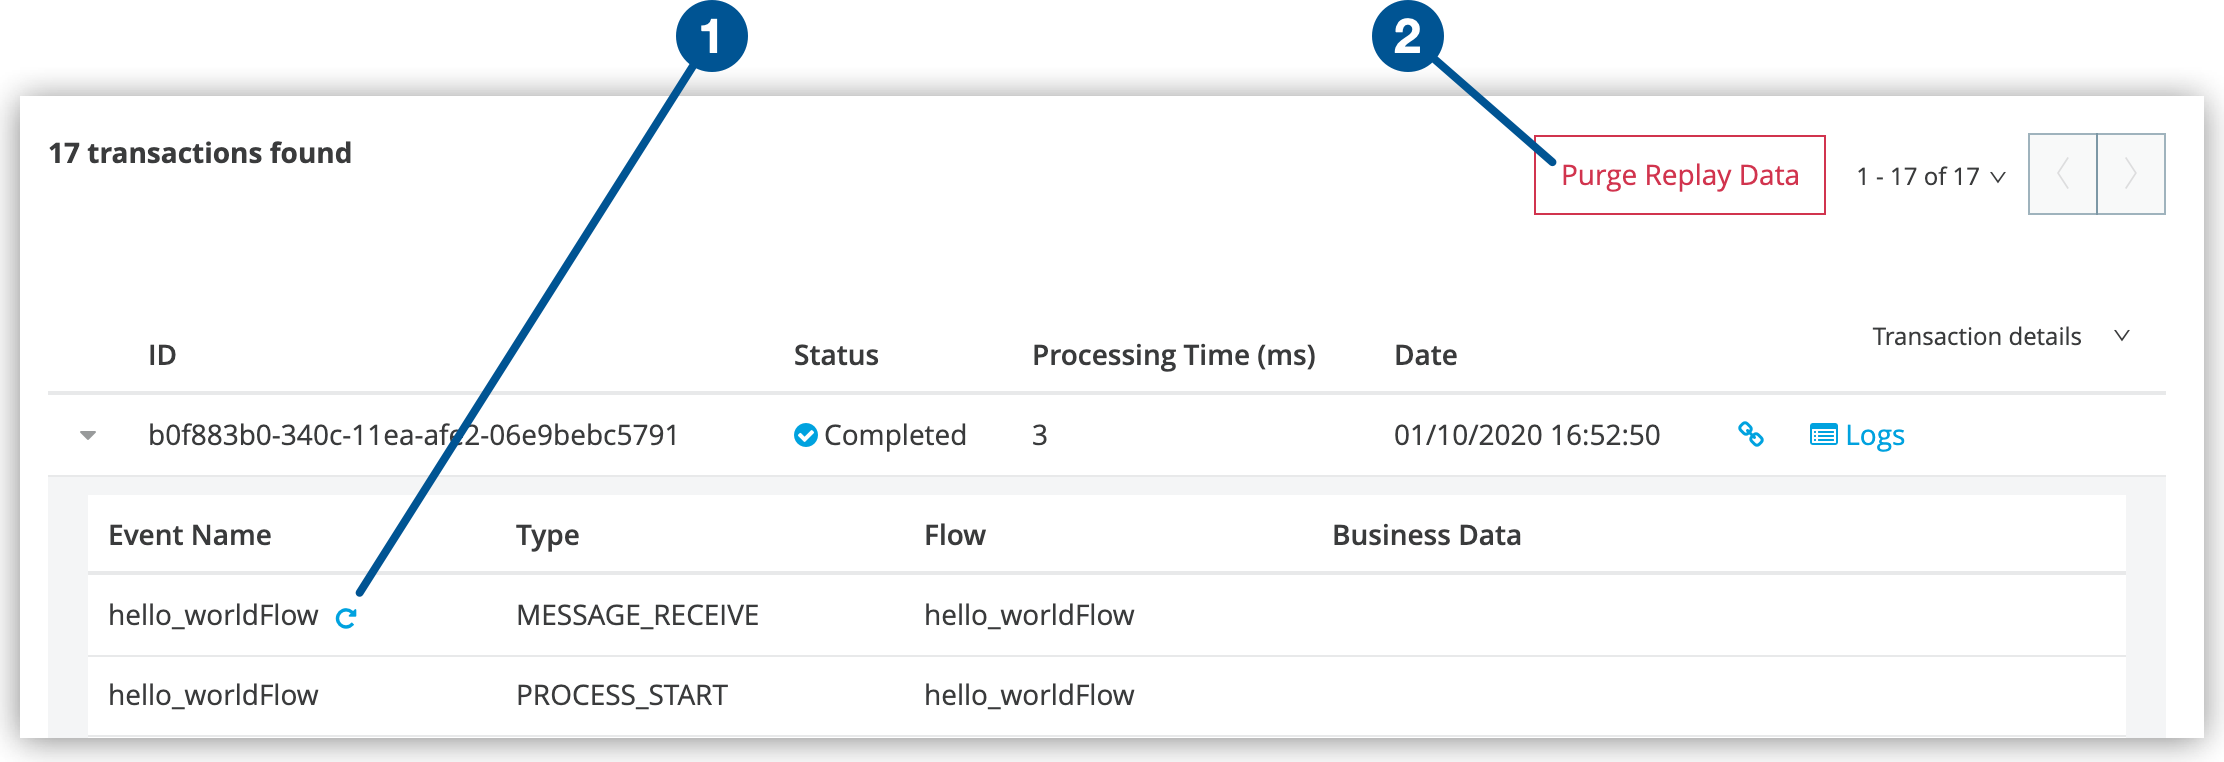 Figure 9. The screenshot shows (1) the replay transaction icon and (2) the Purge Replay Data button.
 -
At the prompt, click Replay Transaction to confirm.
Insight displays an information popup indicating that the transaction was replayed and displays the replayed transactions immediately on the dashboard and in the Logs tab.
Table of Insight Status States
The following table describes the status states that Insight reports:
| Status | Description |
|---|---|
|
The event failed while being processed and has an associated exception. |
|
The event processed fully and successfully. |
|
The event has started and has not yet completed. |
|
The event has been put on hold due to exceeding the maximum number of events to be processed per transaction (10000). Any event above this number is set as stalled and then processed after the number of events to be processed is no longer exceeded. |
|
If a transaction can’t finish within 24 hours, the events with |
Set Up Business Events
You can configure business events in your Mule applications by embedding custom business events in flows or by enabling granular event tracking within message processors in your flows.
-
Custom Business Events
Include custom business event elements at relevant points within the flows of your application to surface the processing information that is most relevant for your business to track.
-
Event Tracking
Track more granular events by enabling default event tracking for your entire flow or for specific message processors or endpoints within your flow. When you configure the flows in your application, you can explicitly configure the scope for default event tracking. See Configure Default Events Tracking.
Customize the Transaction ID
For transaction-level events, Insight might display long numeric values in the ID column. You can customize the transaction IDs to display more intuitive values that are relevant to your business requirements.
To do this, use a Mule expression to configure your Mule application to return meaningful information about a transaction, such as order number, tracking number, or employee identification number. See Customize the Transaction ID.
Enable Trace Data Collection
Traces enable you to understand the path of a transaction in the MuleSoft ecosystem by providing full visibility into the execution path of API calls or application transactions.
When you enable trace data collection for an app, Anypoint Platform collects and exposes tracing information from Mule runtime engine in the OpenTelemetry standard, enabling you to export it using the Anypoint Monitoring Distributed Tracing Experience.
You can enable trace data collection for your CloudHub applications running on Mule version 4.6 or later.
To enable trace data collection for an app:
-
In Runtime Manager, click the Runtime tab.
-
Select the Enable tracing checkbox.
-
Click Deploy Application if you are enabling the feature for a new deployment, or Apply Changes if you are editing an existing application.
After you enable tracing and redeploy your application, the Runtime Manager backend starts instrumenting traces for your application.