Monitor Dashboards on Runtime Manager
The Anypoint Runtime Manager monitoring dashboards give you in-depth visibility into usage metrics about both your deployed apps and the systems they’re deployed to.
Anypoint Platform Private Cloud Edition doesn’t support the Anypoint Monitoring dashboard feature.
To view dashboards, you must have either the Runtime Manager Read Applications permission or the Runtime Manager Read Servers permission for the resource.
Anypoint Runtime Manager provides these dashboards:
-
Application monitoring dashboards
Displays information about applications, including deployment target and status.
Runtime Manager provides two application dashboard interfaces: built-in and classic. The dashboard you see depends on the version, type, and deployment method of the selected application.
-
Provides high-level information about the servers, including heap memory and CPU percentage, as well as detailed memory usage metrics.
-
Server group or cluster monitoring dashboards
Displays aggregated metrics for selected servers in a group or cluster.
Using the information gathered from these dashboards, you can:
-
Set up alerts for applications and servers to notify you automatically when any of these metrics reaches a critical value for a sustained period.
-
Use Insight to help analyze the root cause of failures, isolate performance bottlenecks, and test for compliance with company procedures.
Application Monitoring Dashboards
![]()
![]()
![]()
![]()
The app monitoring dashboards help you answer questions about your integrated apps, such as:
-
When did peaks in usage occur?
-
What impact do high traffic peaks have on response time?
-
How well is the processing power behind my app coping with these high traffic peaks?
-
What impact do high traffic peaks have on the message fail rate?
-
What impact do high traffic peaks of other apps running on the same server have on the performance of a given app?
|
After the worker is restarted, the CPU and memory information is not available in the dashboards. To retain these statistics, use the |
Built-in Anypoint Monitoring Dashboard
The Anypoint Monitoring dashboard provides a wider array of monitoring metrics than the classic application monitoring dashboard and includes several pages in which to view different types of charts.
This dashboard is displayed if the selected application is:
-
Deployed to CloudHub or Runtime Fabric
-
Has Anypoint Monitoring enabled
For information, see Built-in Application Dashboard in the Anypoint Monitoring documentation.
Classic Application Monitoring Dashboard
The classic application monitoring dashboard displays metrics for Mule messages, CPU, and memory.
This dashboard is displayed if the selected application is:
-
Deployed to CloudHub
-
Deployed on-premises (hybrid)
For hybrid apps, the dashboard appears if monitoring is enabled and there are CPU metrics for the last 24 hours of monitoring.
-
Not enabled for monitoring
| The Mule Messages graph displays all Mule messages produced by the application during the specified time frame. |
Access the Application Monitoring Dashboard
When you access the monitoring dashboard for an application, the dashboard you see depends on the version, type, and deployment method of the selected application.
To access the application monitoring dashboard:
-
In Runtime Manager, click Applications.
-
Click the name of the application to monitor.
Navigate the Application Monitoring Dashboard
You can view all graphs for different time ranges by selecting the desired time interval in the top-right corner of the dashboard you are viewing:
-
Built-in Anypoint Monitoring dashboard:

-
Classic application monitoring dashboard:

The following table lists the time units for each selected time range:
Graphs Display the Average, Minimum, and Maximum: Selected Time Range
Number of Mule Messages
Number of Errors
Response Time (milliseconds)
3 Hours
Per minute
Per minute
Per minute
24 Hours
Per 8 minutes
Per 8 minutes
Per 8 minutes
7 Days
Per hour
Per hour
Per hour
2 Weeks
Per 2 hours
Per 2 hours
Per 2 hours
If your application runs on multiple workers, the workers are charted as different curves on the same graphs, differentiated by different colors.
If your application runs on a server group or cluster, the aggregated metrics of the servers in the group or cluster appear as a single plot line on each graph. If you want to see the metrics at the individual server level, you can look at the dashboard for the individual server. If multiple apps are running on the server, you see the overall server performance, without a distinction between each of the apps running on it.
Server Monitoring Dashboard
![]()
![]()
The server monitoring dashboard displays high-level information about the servers, including heap memory and CPU percentage, as well as detailed memory usage metrics.
Access the Server Monitoring Dashboard
To access the server monitoring dashboard:
-
In Runtime Manager, click Servers.
-
Click the name of the server to monitor.
The dashboard for the server appears:
You can also navigate to a server’s monitoring dashboard from the server group or cluster dashboard that includes the server.
Navigate the Server Monitoring Dashboard
The server monitoring dashboard displays metrics divided into two tabs:
You can view all graphs for different time ranges by selecting the desired time interval in the top-right corner of the dashboard you are viewing:
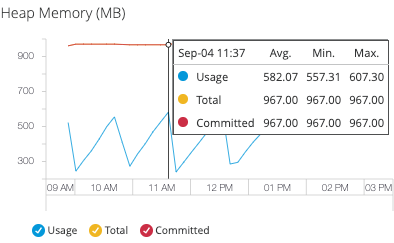
You can display an overlay of numerical detail about activity that occurred at a specific time by hovering over the graph:
If your server runs multiple applications, you can view the performance of each in a separate set of charts by selecting the application checkboxes to display the details pane on the right with this data.
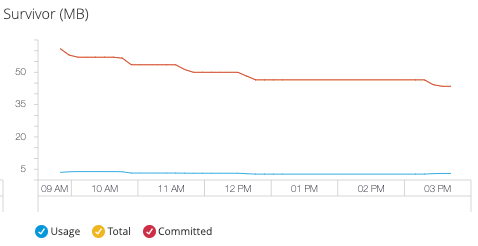
The memory usage graphs on the dashboards track these values:
-
Usage
The amount of memory (in MB) currently in use.
If the Java VM attempts to increase the used memory to be greater than committed memory, memory allocation fails even if the amount of used memory is increased to below the total memory.
-
Total
The maximum amount of memory (in MB) for use by the server. The maximum amount can change or be undefined.
-
Committed
The amount of memory (in MB) available for use by the Java VM. This amount varies over time. The amount of committed memory is always greater than or equal to the amount of used memory.
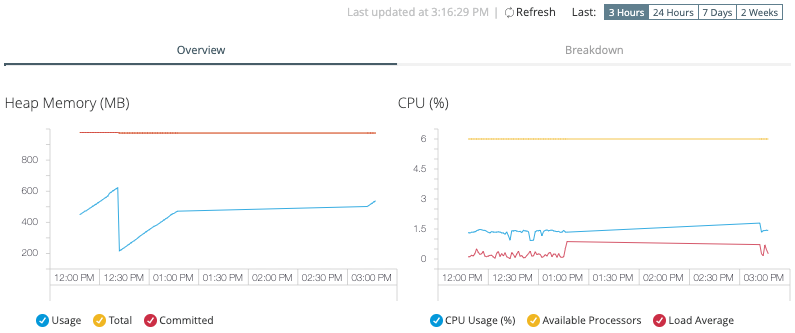
Overview Tab
The graphs in the Overview tab provide high-level metrics related to memory and CPU usage.
- Heap Memory
-
The total heap memory usage in MB:
-
Heap memory usage
-
Total memory
-
Heap committed memory
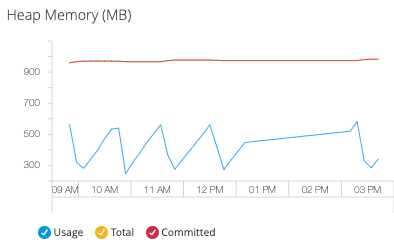
See the Breakdown tab for details about each of the components of the heap memory.
-
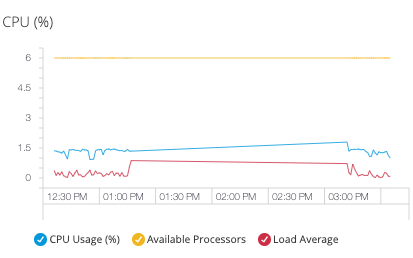
- CPU
-
This metric is not available on Windows.
The total CPU Usage of the server:
-
CPU Usage
-
Available Processors
-
Load Average
-
CPU Usage is a percentage value that indicates how much of the server’s processing capacity is being used. Available Processors is an integer value that indicates the number of processors available in the server. CPU load is the number of tasks that are being executed, or waiting to be executed, by the server’s CPU. Load Average is an integer value that indicates the average number of processes that are running or waiting to be assigned CPU time over a given period of time.
Breakdown Tab
The graphs in the Breakdown tab provide detailed metrics, including graphs that track each part of the server’s memory separately.
-
Heap memory metrics relate to the portion of the server memory that makes up the JVM heap:
-
Non-heap memory metrics refer to memory that exists outside the JVM heap:
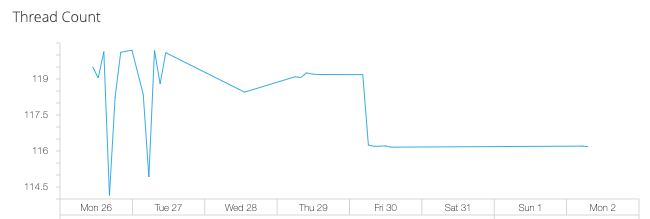
- Thread Count
-
The number of individual Java execution threads over time:
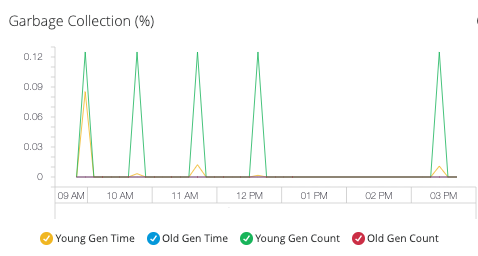
- Garbage Collection
-
Metrics for these areas of the heap:
-
Young Generation, where all new objects are allocated.
-
Old Generation, where long-surviving objects are stored.
-
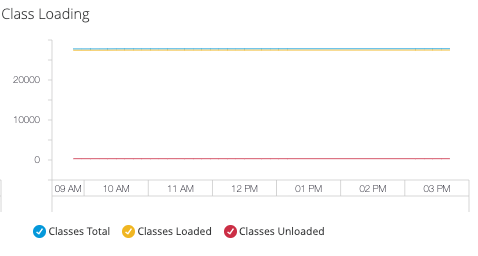
- Class Loading
-
The total number of classes that are currently loaded or being loaded across all apps in the JVM:
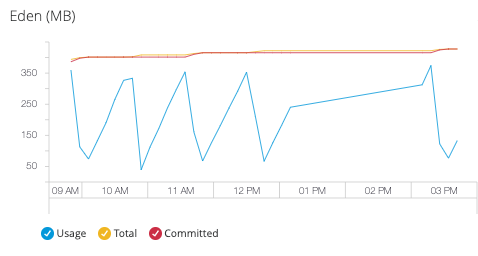
- Eden
-
The pool in the heap space from which memory is initially allocated for most objects.
- Survivor
-
The pool in the heap containing objects that have survived the garbage collection of the Eden space.
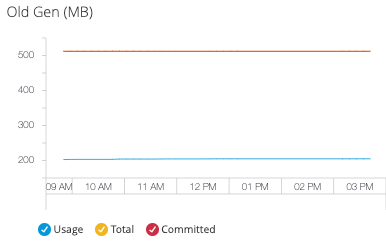
- Old Gen
-
The pool in the heap containing objects that have existed for some time in the Survivor space.
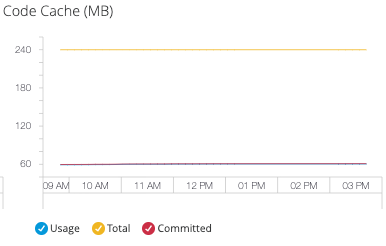
- Code Cache
-
The space containing memory that is used for compilation and storage of native code.
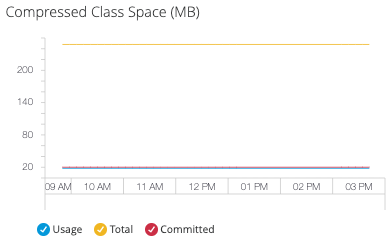
- Compressed Class Space
-
This metric is available only when using JDK 8+.
- Metaspace
-
The JVM memory space that uses native memory for the representation of class metadata.
This metric is available only when using JDK 8+.
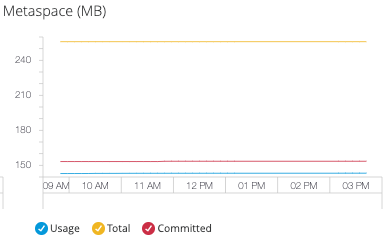
The metaspace limit is currently 256 MB.
Server Group or Cluster Monitoring Dashboard
![]()
![]()
You can use the server group or cluster monitoring dashboard to view aggregated metrics for servers in a group or cluster.
The server group or cluster monitoring dashboard displays these aggregated metrics:
-
CPU usage, as a percentage of the capacity
-
Memory usage, in MB
-
Heap total, in MB
The aggregated metrics of the selected servers appear as a single plot line on each graph.
Access the Server Group or Cluster Dashboard
To view aggregated metrics for servers in a server group or cluster for on-premises deployment:
-
In Runtime Manager, click Servers.
-
Click the cluster or server group name to display the dashboard.
-
Select one or more servers or applications from the list to display aggregated metrics in the details pane.
Navigate the Group or Cluster Dashboard
You can view graphs for specific periods by selecting the time interval in the top-right corner:
You can display this information for either servers or applications by clicking the appropriate tab:
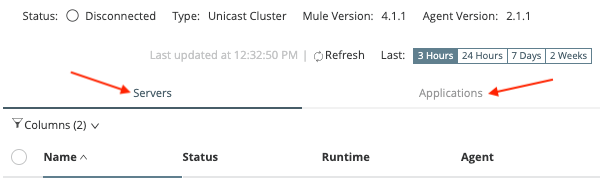
From this dashboard, you can click a server or application name to access the dashboard for that item.
Troubleshoot Anypoint Monitoring Metrics not Working in Server Groups
If Anypoint Monitoring does not publish metrics immediately after installing the Anypoint Monitoring agent on a hybrid server in a server group, follow these steps to correctly install Anypoint Monitoring to a server in a server group:
-
In Anypoint Platform go to Runtime Manager > Servers > Add Server to create an Anypoint Runtime Manager token.
-
Execute the command provided in the Add Server screen.
-
In Anypoint Platform go to Runtime Manager > Servers > Create Group to create the server group.
-
Start Mule for all the servers to be added to the server group by using the command
./mule startfrom the$MULE_HOME/bindirectory. -
In Anypoint Platform go to Runtime Manager > Servers, click the server group name, and Add Server to add all the servers to the group.
-
Deploy an API to the server group.
-
Stop any running filebeat process in all the servers of the server group and run the
./installcommand from the$MULE_HOME/am/bindirectory in all the servers of the server group. -
In Anypoint Platform go to Runtime Manager > Servers, click the server group name, and restart all the servers in the server group via Actions > Restart.
-
Run
./setupfrom the$MULE_HOME/am/binfor all the servers in the server group.If after this step the metrics don’t show up, repeat the last two steps.